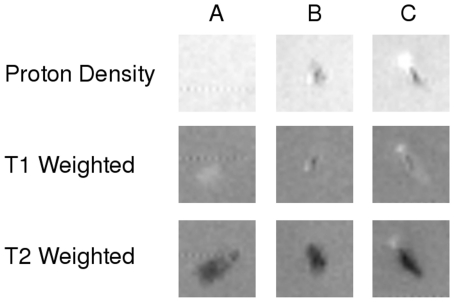
Figure 1. Typical MR Images of thrombus obtained at 9.4 T.
Proton density (showing the amount of water), T1 and T2 weighted images (highlighting differences in T1 and T2 relaxation times respectively) of 3 samples obtained after thrombectomy. A) Thrombus, clotted blood, B) sample composed mainly of lipids and C) sample of mixed composition.

