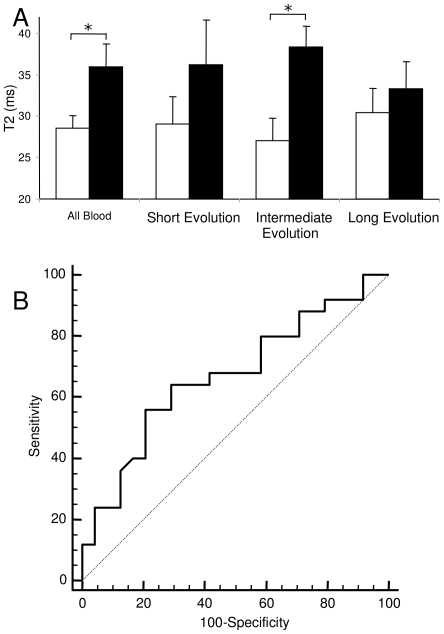
Figure 3. T2 values of coagulated blood.
A, graph showing T2 values for coagulated blood. The first columns correspond to all blood samples, the others to groups divided according to their evolution time. White bars ST Resolution, full bars Non ST resolution. *statistical difference p<0.05. B corresponds to the receiver operating characteristic (ROC) curve obtained as described in the methods section. Area under the curve is 0.70, p = 0.03.

