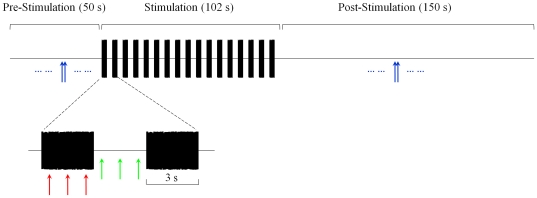
Figure 1. Schematic of the experimental paradigm.
Each SOAE was monitored for 302 s. Baseline SOAE level and frequency were established in the pre-stimulation window. Contralateral broadband noise pulses (3-s long, 68 dB SPL) were presented in the 102-s stimulation window with 3-s inter-pulse intervals. Blue arrows represent SOAE estimates in the pre- and post-stimulation windows, red arrows during noise pulses, and green arrows during inter-pulse intervals. This color convention is consistent throughout the paper. Each arrow represents an estimate of SOAE level or frequency averaged over a 1-s window.

