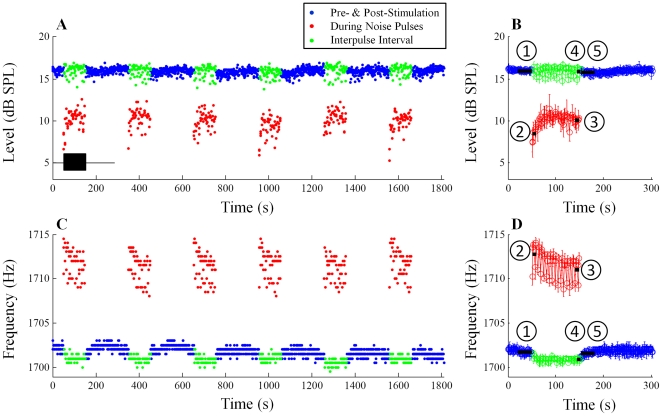
Figure 2. Example of MOC effects on one SOAE (subject WTPF01).
SOAE level over six consecutive repetitions of the stimulation paradigm (A), and averaged level over six repetitions (C) are shown in the top row (blue: pre- and post-stimulation windows; red: during noise pulses; green: inter-pulse intervals). The black rectangular box in Panel A represent the noise pulses which are shown only for the first experimental run but were repeated six times. Baseline ( ) is defined as the median SOAE level/frequency in the 30-s window before noise onset. Similarly, SOAE levels/frequencies during the first two noise pulses (
 ), during the last two noise pulses (
 ), during the last two inter-pulse intervals (
 ) and in the 30-s window after noise offset (
 ) were quantified. Differences from the baseline were defined as fast change (
 -
- ), adaptation change (
 -
- ), buildup change (
 -
- ) and slow change (
 -
- ). Error bars represent one standard deviation.

