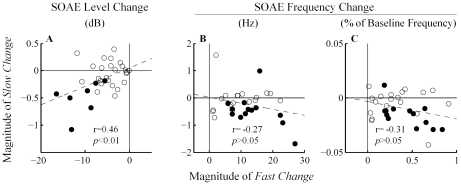
Figure 5. Correlation between MOC-induced fast and slow changes in SOAE level (A) and frequency (B, C).
Filled symbols indicate that both fast and slow changes were statistically significant (t-test, p<0.01), whereas open symbols indicate otherwise. A positive correlation for SOAE level was observed. Dashed lines represent best linear fits to all of the data points.

