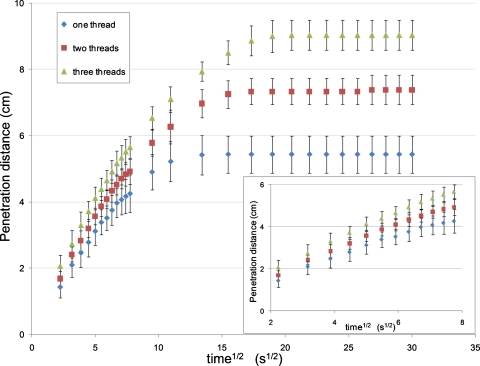
Figure 3.
A graph of penetration distance vs the square root of time for (i) a single thread, (ii) twisted pair, or (iii) twisted triple. The graph highlights a linear relationship between penetration distance and the square root of time over the first minute (∼8√s), concordant with the Washburn equation. After this the curve flattens out and reaches an ultimate penetration distance due to the effects of evaporation and gravity.

