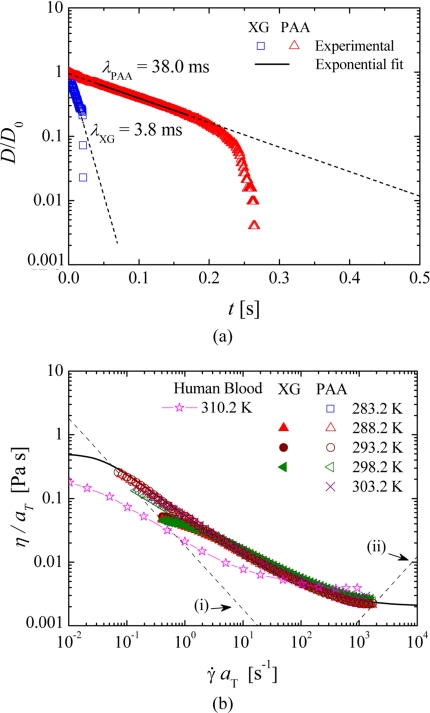
Figure 2.
(a) Time evolution of the midpoint diameter of the fluid thread in a CaBER experiment at 293.2 K. The symbols represent the experimental data and the lines represent the exponential fit to the experimental data. (b) Master curves of the steady-shear viscosity for the XG and PAA blood analog solutions (symbols) and fit to the GNF model used in the numerical calculations (line). The steady-shear data for human blood at 310.2 K reported in Chien (Ref. 15) are also shown for comparison purposes. (i) Minimum measurable shear viscosity determined from 20× the minimum measurable torque of the rheometer. (ii) Onset of secondary flow due to Taylor instabilities for the 75 mm, 1° cone-plate geometry.

