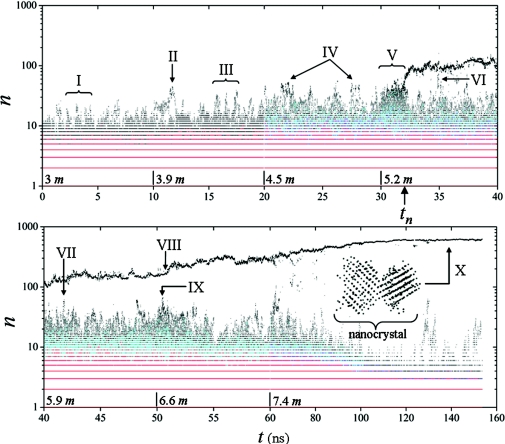
Figure 1.
Contour map of ρ(n, t): ρ = 1 is in black, ρ = 2 is in cyan, ρ = 3 is in blue, and ρ > 3 is in red. The quantity n is the number of ions in the clusters and represents the cluster size. Ions are injected every 10 ns, starting with a concentration of ∼3 m up to a maximum of ∼7.4 m (∼17% oversaturation); concentrations after each injection are indicated on the time axis. Major events along the trajectory are labeled from I to X (see text). The nucleus emerges at tn ∼32 ns and grows irreversibly into a “poly”-nanocrystal in equilibrium with concentrated solution. The nanocrystal is composed of two conjoint crystallites separated by a grain boundary, as shown in the inset of the lower panel (the dots represent Na+ or Cl− ions forming two interpenetrating fcc structure characteristic of a macroscopic NaCl crystal). The time scale changes for t > 60 ns.

