Figure 2.
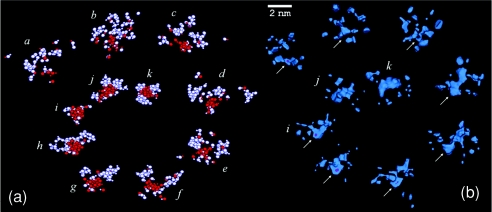
(a) Snapshots of the cluster buildup along the pathway leading to the formation of the first stable nucleus at tn ∼32 ns (i): frames (a)–(i) taken every ∼0.25 ns, (j) at ∼33 ns, (k) at ∼38 ns. Ions that end up forming the stable core of the nucleus are shown in red; all others ions, including those composing the amorphous phase on the nucleus’ surface, are shown in white; about a dozen monomers (fully dissociated ions) contribute to the formation of the nucleus but are not shown. (b) Low water-density maps along the nucleation pathway shown in (a). Arrows indicate the location of the emerging nucleus. The scale applies to (b) only.

