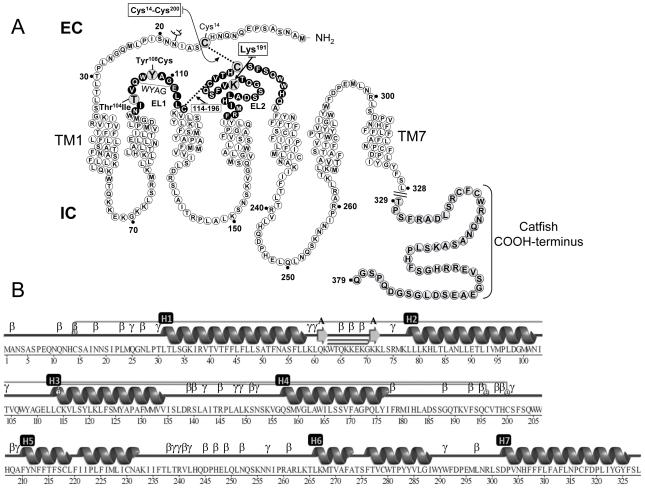
Figure 1.
A: Schematic representation of the hGnRHR amino acid sequence. Residues shown in black circles are in the EL1 and EL2 regions; large grey circles show the amino acid residues mutated or deleted in the present study. Also shown is the sequence of the catfish COOH-terminus (residues 329-379) added to the WT hGnRHR and receptor mutants. EC: intracellular space; IC: intracellular space. B: Schematic representation of the primary and secondary structure of the hGnRHR based on a model recently published by Jardon-Valadez and colleagues (Jardon-Valadez et al., 2008b). Structures were obtained using PDBsum (Laskowski, 2009). Linear representation of secondary structure is represented as cartoons, TM helices are labeled as H1-7, and β and γ labels in B indicate β and γ turns, respectively. Disulfide bridges are represented by gray lines joining the corresponding Cys residues.

