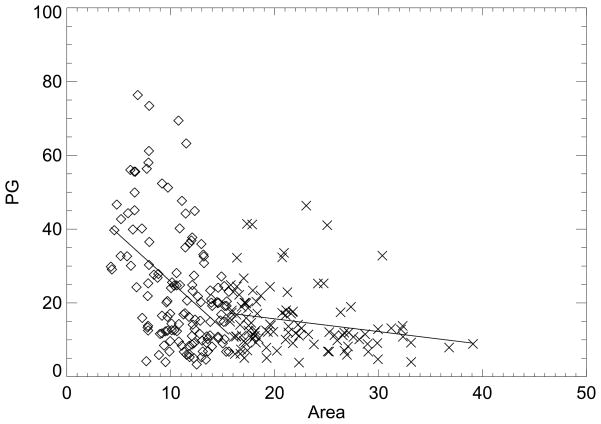
Figure 3.
Breast area and percent glandular breast density measure regression analysis. This shows breast area (area) expressed in 105 pixel units and percent glandular measure (PG) ordered pairs and fitted lines (solid) for the case samples (Table 3). The regression analysis was split into two parts for above (×) and below (diamond) the case breast area distribution mean.

