Fig. 5.

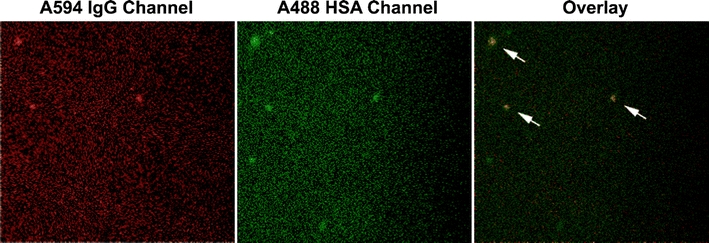
A video frame containing aggregates captured in the IgG and HSA channels using the dual color mode of fSPT, with the corresponding overlay image.

A video frame containing aggregates captured in the IgG and HSA channels using the dual color mode of fSPT, with the corresponding overlay image.