
Figure 3.
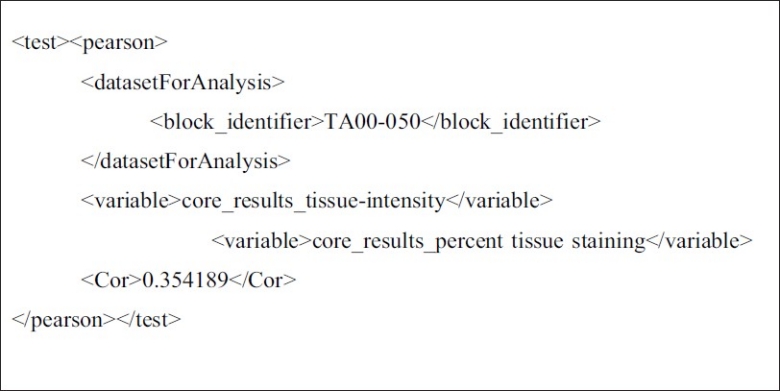
XML representation of the inputs to a Pearson's Correlation test applied to one analysis dataset. This test measures correlation between two results. Two variable CDEs identify core_results_tissue-intensity (the intensity of a stained tissue sample) and core_results_percent-tissue-staining (the percent of that same sample that is a certain color) as being tested for correlation. Correlation is determined for each core associated with “TA00-050” block