
Figure 1.
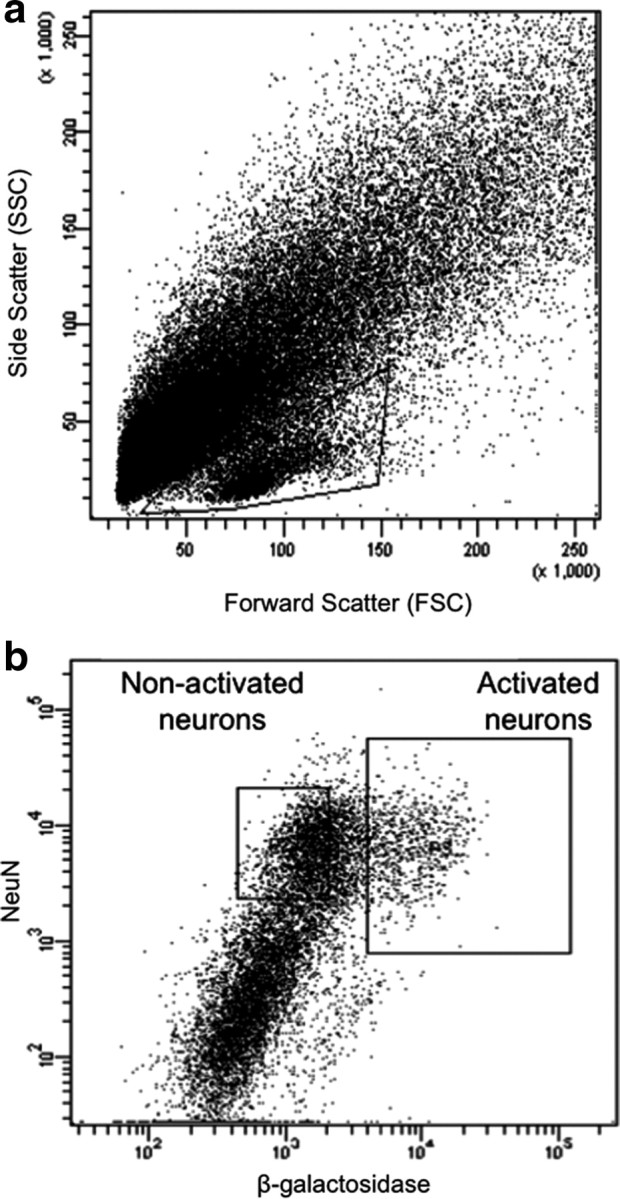
Fluorescence-activated cell sorting of β-gal-labeled neurons from rats treated with a single injection of cocaine. a, Light scatter plot in which each dot represents one event (cell or debris). Forward scatter is a measure of size; side scatter is a measure of granularity. The “gate,” indicated by the solid-line box, encompasses all events that are analyzed on subsequent fluorescence plots. This gate allows analysis of cells and exclusion of debris. b, Fluorescence plot in which each dot represents one event. NeuN antibody labels all neurons; β-galactosidase antibody labels activated neurons. Two collection gates, indicated by the solid-line boxes, encompass activated and nonactivated neurons that were collected for further analysis.