
Figure 1.
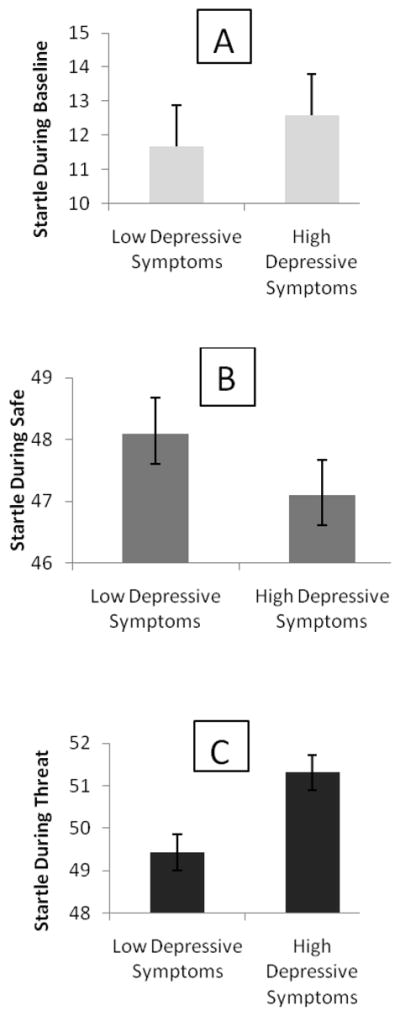
Children’s Depressive Symptoms and Their Startle Magnitude During Baseline (Panel A; N = 89), Safe (Panel B; N = 89), and Threat (Panel C; N = 89).
Note: Error bars represent standard errors. The sample was divided into the two groups (“high” and “low” depressive symptoms) using a median split. Startle data is reported in Hz units and was t-transformed prior to analysis. Values presented here reflect mean startle magnitude across condition (baseline, safe, threat).