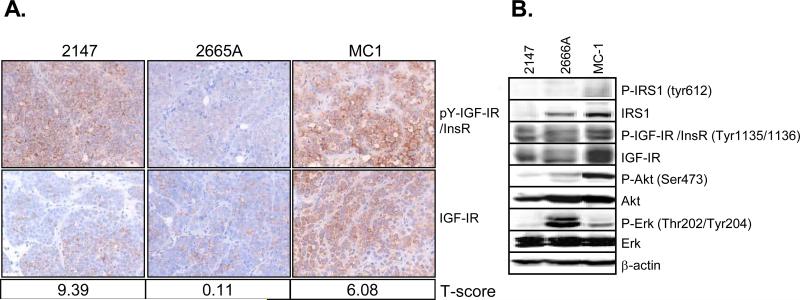
Figure 5. TNBC tumorgrafts express high levels of active IGF-IR.
A. Three different TNBC tumorgraft lines (2147, 2665A, MC1) were harvested and processed in paraffin. Immunohistochemistry was performed on five-micrometer sections for anti-pY-IGF-IR (Phospho-IGF-IR) and total IGF-IR. Microarray analysis was performed on these tumorgrafts. Based on the gene expression data an IGF signature t-score was calculated for each tumorgraft as indicated underneath the representative picture. B. The same three tumorgraft lines were lysed and analyzed by immunoblot and probed using IGF-IR specific antibodies as well as total/phospho-specific antibodies for IRS1, AKT, ERK1/2. β-actin was used as a loading control. Tumorgraft lines that were not relevant to this study were cropped out between 2665A and MC1.

