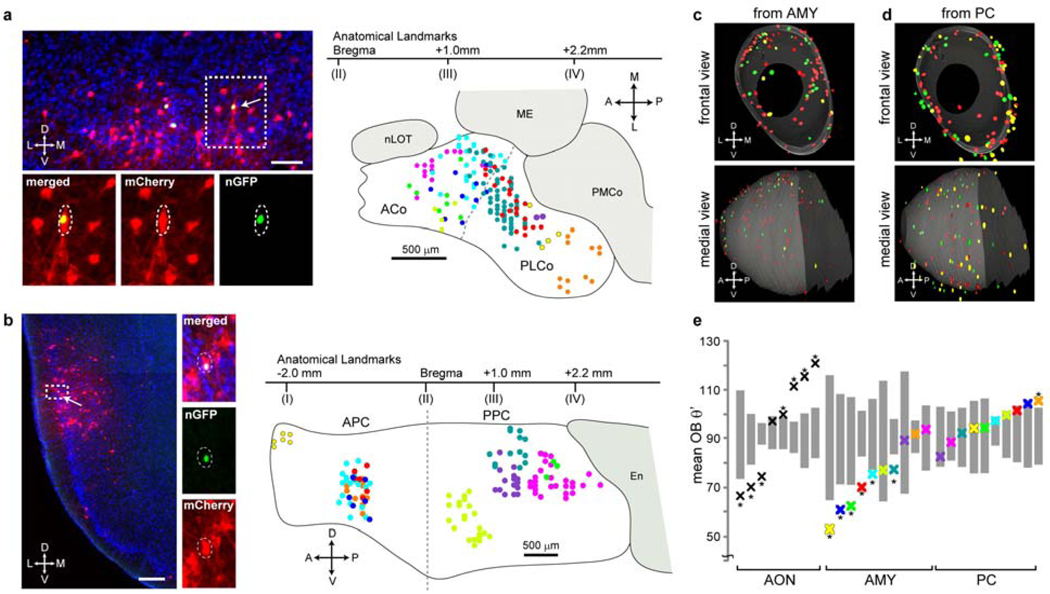
Figure 3. Representations of OB input in the amygdala and piriform cortex.
a-b, Starter cells from the cortical amygdala and piriform cortex. Left, single coronal sections at the injection sites in the posterolateral cortical amygdala (a) and the posterior piriform cortex (b). Arrows point to starter cells magnified in insets. Scale bars, 100 µm in a, 200 µm in b. Right, schematic representations of 10 independent injections each into amygdala (a) or piriform cortex (b). Starter cells from each injection are labeled with a specific color. The dotted line denotes the rough border between ACo (anterior cortical amygdala) and PLCo (posterolateral cortical amygdala) based on anatomical landmarks according to a mouse brain atlas49. nLOT, nucleus of lateral olfactory tract; ME, medial amygdala; PMCo, posteromedial cortical amygdala; APC, anterior piriform cortex; PPC, posterior piriform cortex; En, lateral entorhinal cortex. c-d, Superposition of three independent 3D-reconstructions of glomerular maps with starter cells from the cortical amygdala (c) or the piriform cortex (d). e, Mean θ’OB values (crosses) from each experiment are plotted in the same column with the 95% confidence intervals for corresponding simθ’OB values (gray bars). Samples with experimental mean θ’OB outside the 95% confidence intervals are labeled with asterisks (*, p<0.05). Colors in a (scheme), c and e (AMY) are matched to represent the same samples, and so are the colors in b (scheme), d and e (PC).

