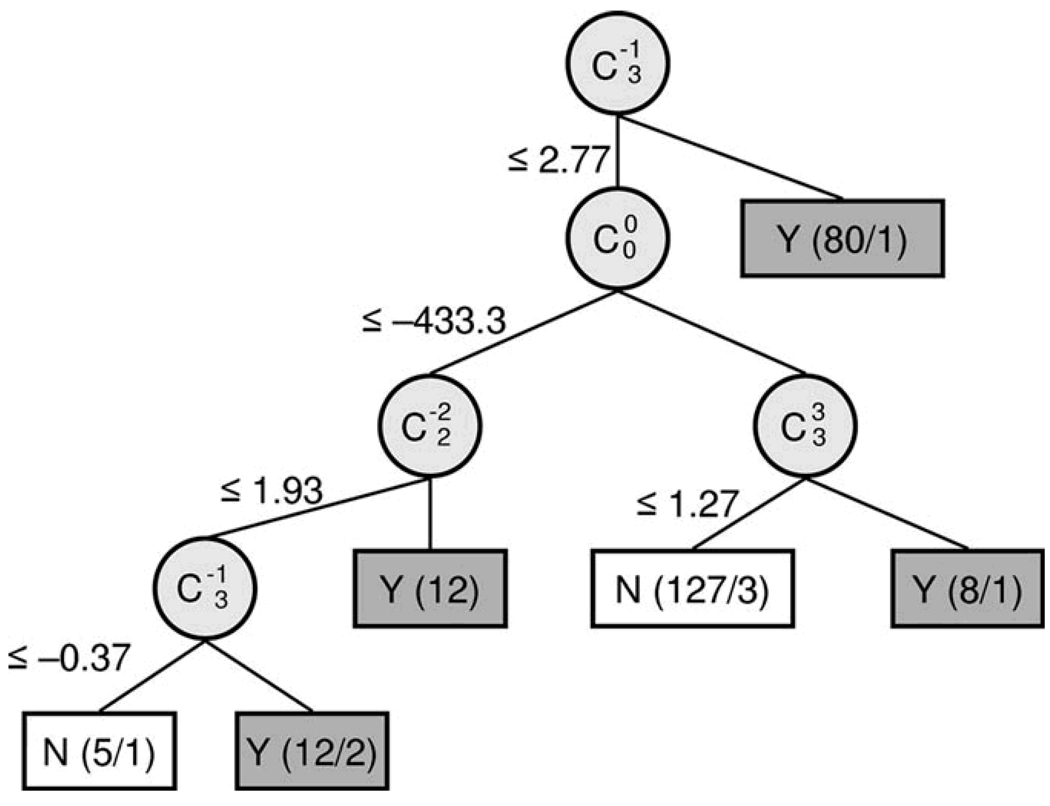
Figure 1.
Decision Tree Classification of Keratoconus. Decision Tree generated with C4.5, an automated induction algorithm. Classification attributes (circles) are labeled as double indexed Zernike polynomial coefficients using Optical Society of America conventions. The split criteria values label the branches of the decision tree in units of micrometers. Terminal nodes of the tree (boxes) are labeled with class assignments (Y = Keratoconus, N = Normal) and the number of records assigned to this class (correct / incorrect); total n = 244; Keratoconus n= 112; Normal = 132.

