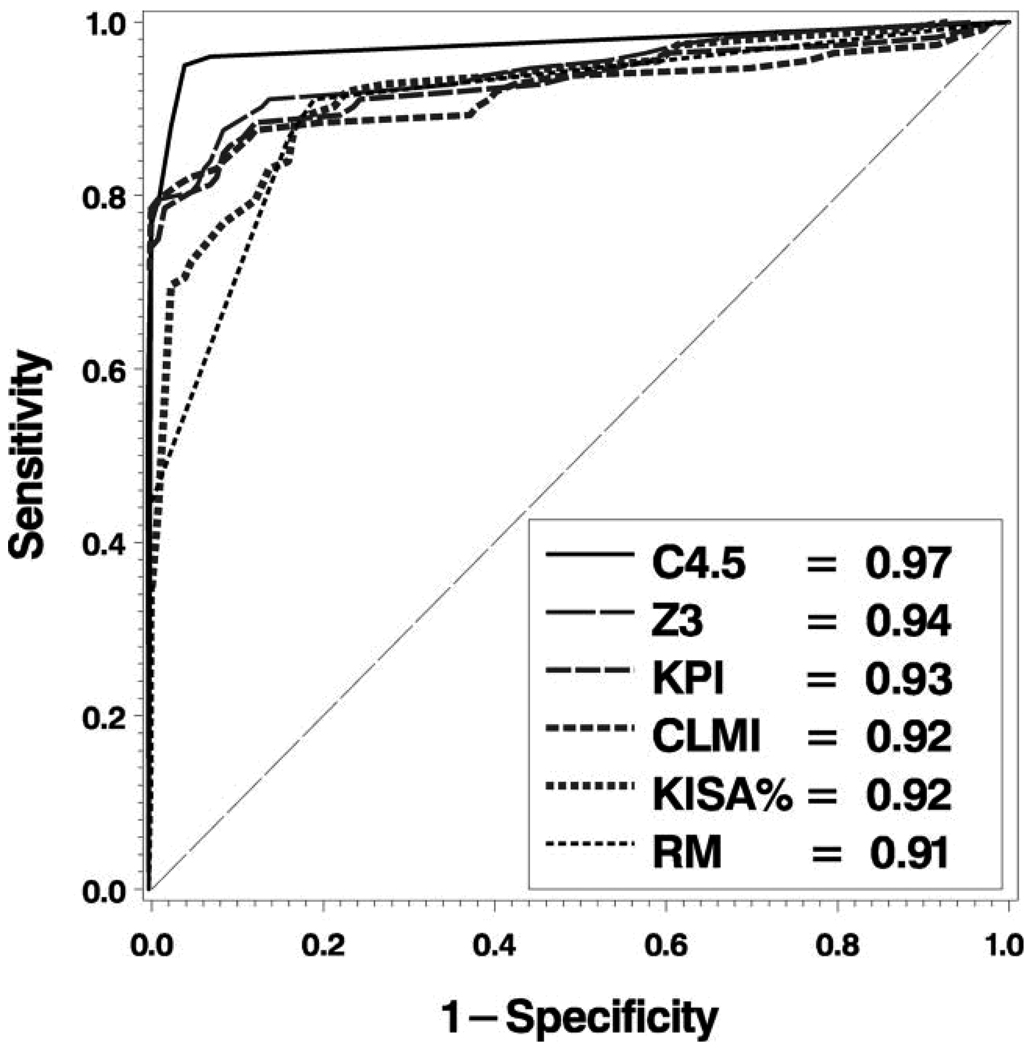
Figure 3.
ROC Analysis. ROC curves and associated area under curve (see legend) for each of the 6 classification methods: C4.5 = Decision tree classifier; CLMI = Cone Location and Magnitude Index; RM = Modified Rabinowitz–McDonnell Index;10 KPI = Keratoconus Prediction Index;6 Z3 = 3rd order Zernike Polynomial Index;25 KISA% = K-value, IS-value, and Astigmatism Index.10

