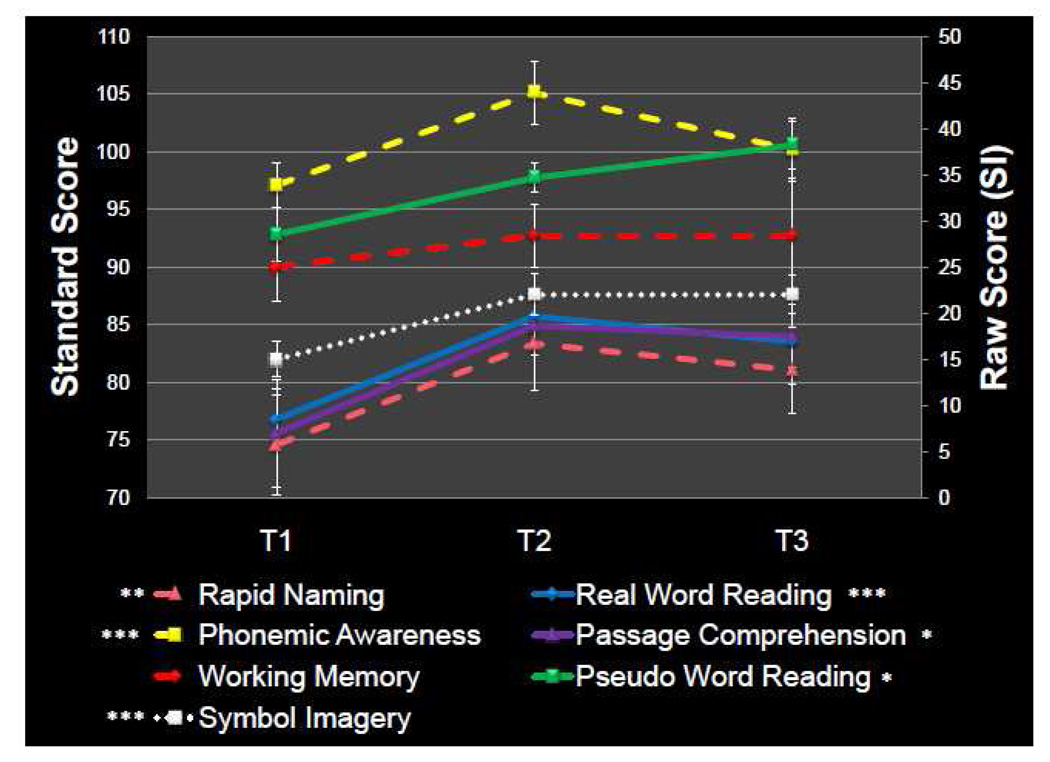
Figure 1.
Behavioral Score Changes Over the Course of Reading Intervention: Test scores for each of the three time periods: before intervention (T1), after intervention (T2) and after the period of no intervention (T3). Solid lines represent direct measures of reading ability and dotted lines represent skills predictive of reading ability (as discussed in text). Symbol Imagery (in white) corresponds with the y-axis on the right because unlike the other measures the scores are raw and not standardized. Significant increases in score are noted (* p<0.05 ** p<0.01 ***p<0.001) as tested by post hoc t-tests run after a one way repeated measures ANOVA. No significant changes were seen between time points 2 and 3.

