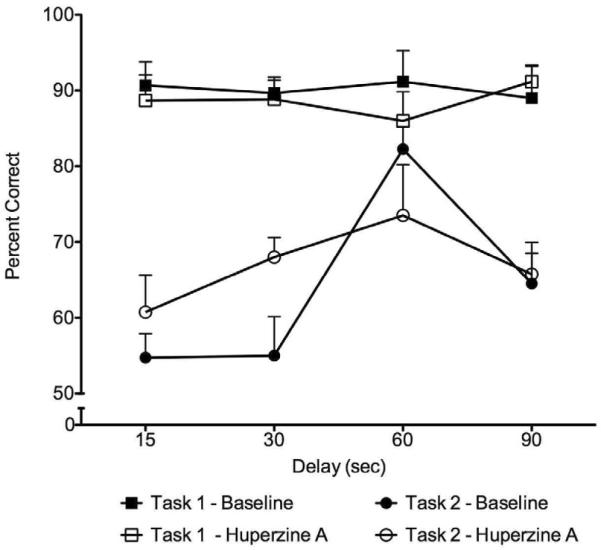
Figure 2.
Percent correct responses on each delay in Task 1 (squares) and Task 2 (circles) during baseline (filled symbols) and after huperzine A administration (open symbols). Within-subject analysis of variance with repeated measures indicated no significant effects of treatment, delay, or interaction between these two factors for either Task 1 or Task 2 (all ps>0.05).

