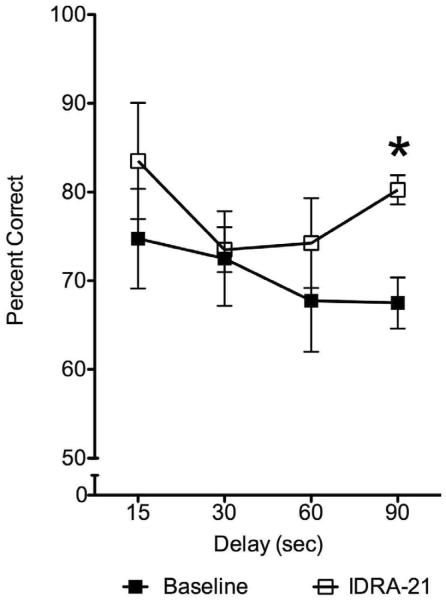
Figure 3.
Percent correct responses on each delay in Task 2 during baseline (filled symbols) and after IDRA 21 administration (open symbols). Within-subject analysis of variance with repeated measures resulted in a significant effect of drug (p<0.003) but no significant effect of delay, or interaction between drug and delay. IDRA 21 treatment improved performance on each delay with the largest improvement observed on the 90s delay (paired t-test, p<0.002); * denotes significant difference between baseline and IDRA 21 treatment in this delay.

