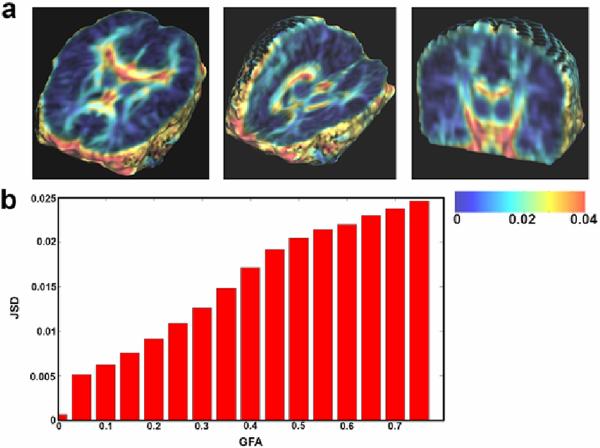
Fig. 1.
(a) The color-coded map shows that the JSD, a measure of fiber complexity, is greater in regions of high diffusion anisotropy (e.g., the corpus callosum), especially at interfaces between high and low anisotropy. This trend is clear when plotting JSD against the GFA (b). This property of JSD is useful because in DTI/HARDI studies, diffusion properties are more informative in highly anisotropic regions, where fiber structures are highly resolved.

