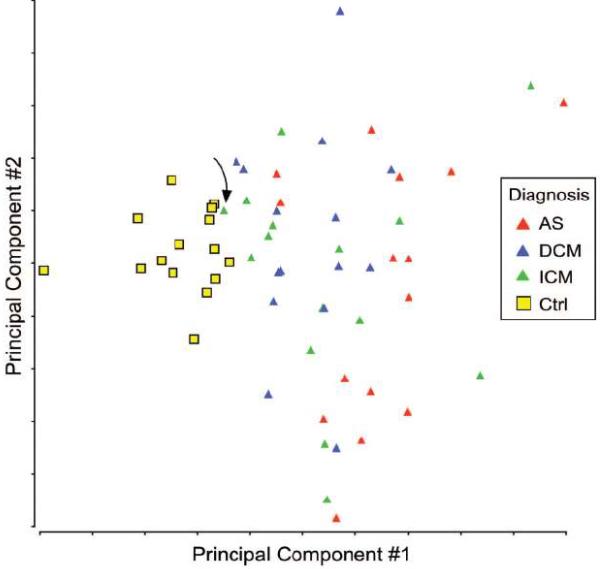
Figure 6. Altered RNA Splicing Distinctly Clusters Control and Disease Samples.
MYH7-2, TNNT2, and FLNC splicing ratios measured in 60 samples were visualized by principal component analysis. The control samples were tightly clustered together and clearly distinguished from the disease samples. Arrow indicates sample prone to misclassification as control.

