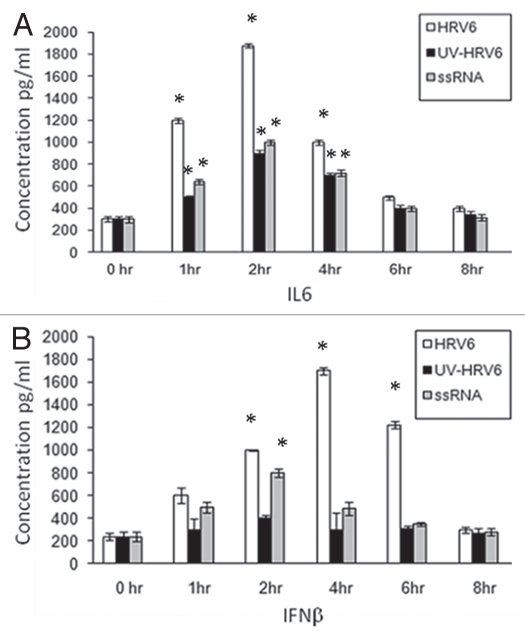
Figure 2.
HRV6 activation of human airway epithelial cells. Human bronchial cells were either not stimulated (grey bar charts) or stimulated with HRV6 virions (1 × 10³ PFU/ml) (black bar charts), UV HRV6 (white bar charts) or HRV6 ssRNA (stripped bar charts) for different hours. The supernatants were harvested and assayed for cytokine secretion using the Cytometric Bead Array (CBA) system (Becton Dickinson). Fluorescence was detected using a FACSC alibur (BectonDickinson). IL6 secretion is depicted in graph (A) while IFNβ in graph (B). The data presented is the mean of three independent experiments. Asterisks denote statistical significance (p < 0.001).

