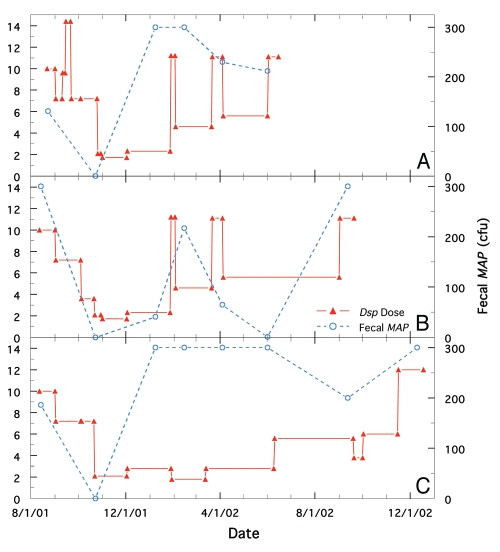
Figure 1.
Comparison of longitudinal changes in fecal MAP at different doses of Dietzia for cows, R100, Green-4 and Green-1, all initially positive for AGID and all possessing initially high ELISA and MAP values. Solid red line is Dietzia dose and dashed blue line is fecal MAP. (A) Cow, R100. (B) Cow, Green-4. (C) Cow, Green-1.

