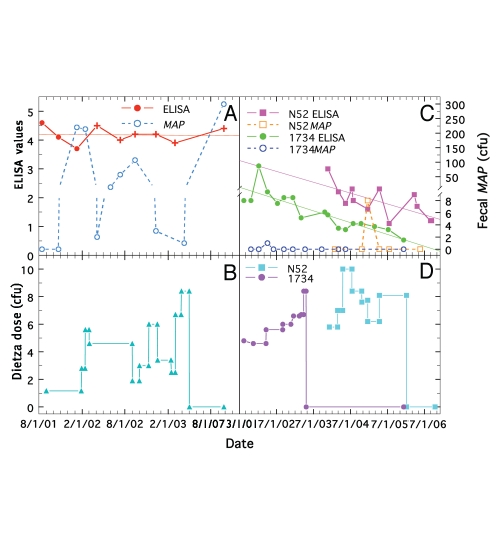
Figure 2.
Longitudinal changes in ELISA values and fecal MAP at different doses of Dietzia for paratuberculosis cows, F16, 1734 and N52, each initially negative for AGID and fecal shedding. (A and B) cow F16. (A) Solid line is ELISA values (best-fit is thin solid line) and dashed line is fecal MAP. Symbol (+) signifies ELISA value was also positive for AGID. (C and D) cows N52 and 1734. Solid lines are ELISA values (best-fit is thin solid line) and dashed lines are fecal MAP. (B and D) Dietzia dose in cfu.

