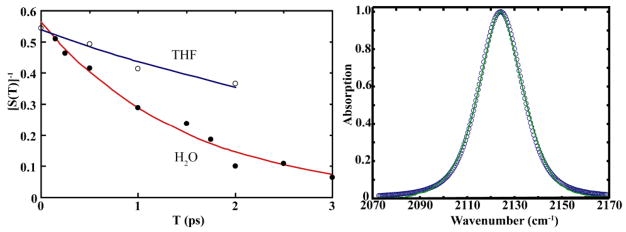
Fig. 4.
Inverse Slope [S(T)]−1 vs population time for 2′-azido-2′-deoxyuridine in water (closed circles) and THF (open circles). The smooth lines are the corresponding fits to equations 1 and 2 using the parameters in the text (Right). Linear IR spectra of 2′-azido-2′-deoxyuridine. The solid line is the absorption experimental absorption line shape and the open circles are the fitted linear IR spectrum (Left).

