Abstract
In vivo proton magnetic resonance spectroscopy (1H MRS) is rapidly becoming useful as a clinical tool for diagnosing and characterizing breast cancers. Alterations of the levels of choline-containing metabolites are associated with malignancy. High-field MR scanners at 1.5 T, 3 T, 4 T, and 7 T have been used to evaluate the role of 1H MRS measurements of total choline containing compounds in patients with breast cancer. This article will review clinical use of MRI/MRS in vivo. Newer developments in high field MR scanning and quantitative MRS may help breast imagers improve sensitivity and specificity in diagnosing and treating breast cancer.
Introduction
Over the past few years researchers have used proton magnetic resonance spectroscopy (1H MRS) for characterizing breast cancers. The clinical application of this research will help breast imagers improve diagnostic accuracy and also help oncologists in monitoring the response to breast cancer therapy.
In vivo breast MRS can show a resonance at ~ 3.2ppm that is associated with malignancy. This peak includes contributions from choline, phosphocholine, glycerophosphocholine, and several other metabolites. The contributions of the various metabolites can be separated in ex vivo MR studies, but in vivo, the resonances are broader and appear as a single peak, called total choline, tCho. It is the phosphocholine metabolite that is increased the most in breast malignancies, and this aberrant increase in concentration parallels tumorgenesis, with high grade breast cancers associated with increased phosphocholine concentrations (2,3). The root cause of this increased phosphocholine is still under investigation, but may be due to increased choline kinase activity (4,5), increased phospholipase C expression (5), and increased activation of phospholipase (3,6) phospholipase D (7). The elevated tCho at 3.2 ppm that is observed in many in vivo breast cancers is attributed to both increased intracellular phosphocholine concentration and increased density of breast cancer cells in the lesion.
The use of tCho as a diagnostic biomarker in breast cancer has been successfully shown at many institutions using 1.5T MR with many different acquisition and analytical techniques. Most studies on 1.5T scanners have not performed quantitative tCho measurements but rather aimed to detect the tCho 3.2 peak, under the assumption that a detectable tCho peak indicates malignancy. MRS tCho measurements are greatly improved on higher field scanners (i.e. 3 Tesla and above). The increased sensitivity (8,9) and greater spectral resolution (10) improves the detectability and quantitation of tCho. The ability to detect tCho in smaller lesions is enhanced at higher field strengths, and quantitative measurement errors also decrease.
The quality of MRS measurements depends on MR sensitivity, spectral resolution, voxel localization performance and the elimination of artifacts. Sensitivity increases linearly with voxel volume, increasing magnetic (B0) field strength, and the square root of the number of averages acquired in the MRI/MRS sequence. In addition, breast coil design shows a large variation in sensitivity (14–16). Spectral resolution is increased by higher B0 field strengths and by optimizing B0 shimming to improve MRI field homogeneity over a given region of interest (ROI) of a breast tumor.
The majority of breast MRS studies have been performed using single voxel spectroscopy (SVS) with localization techniques such as PRESS (17,18), STEAM (19), and LASER (20). These SVS methods are good for studying a single breast lesion. These techniques provide good localization and the operator (radiologist or MRI technologist) can optimally adjust the MRS acquisition parameters (power, B0 shim, water suppression) over a small volume.
Another MRS technique called spectroscopic imaging (SI) gives information about the spatial variation of spectroscopic signals across a series of voxels obtained in the same acquisition. Several investigators have shown it is feasible to perform SI in the breast on clinical MR systems (21–24). SI could provide MRS data for an entire breast to help localize and diagnose a breast cancer. This SI technique is presently used clinically in prostate cancer MRI/MRS imaging (13). Spectroscopic imaging is more complicated technically because magnetic field (B0) shimming, fat suppression, localization and quantification are more difficult than for single voxel spectroscopy (SVS). The majority of MRS breast cancer published work has used the SVS technique.
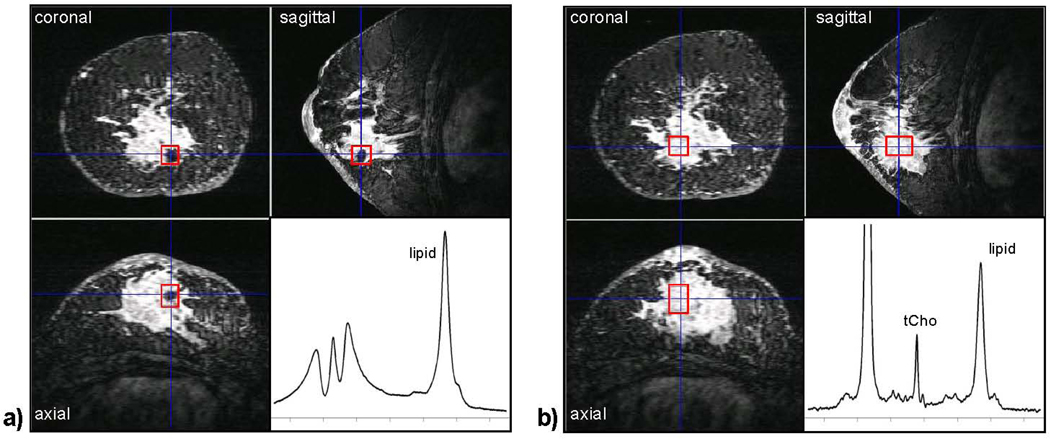
The placement of the voxel for SVS imaging requires high quality 3D imaging to identify the cancer on dynamic contrast enhanced (DCE) imaging and an experienced radiologist to plan the ROI for MRS acquisition. This planning should be done using multiplanar reformats of the 3D images acquired within the first 1–2 minutes after contrast is injected. The size and position of the voxel must cover the solid lesion while minimizing adjacent fibroglandular or adipose tissues. Increasing the voxel size will increase SNR but it also can cause artifacts from adipose tissues. Multiple errors in SVS can be caused by patient positioning, changes in tumor size after treatment, and changes with DCE after treatment. In the follow-up of large cancers, MRS voxel placement should avoid areas of tumor necrosis, cysts, and voids from radiographic markers (figure 1).
Figure 1.
The effect of radiographic markers on shim quality. Both (a) and (b) show a three-view multi-planar reconstruction of a 3D, fat-suppressed, post-contrast image acquired at 4 T in a patient with an invasive ductal carcinoma. The voxel ROI (box) in (a) is placed directly over a metallic radiographic marker. Even after manual adjustment of the linear B0 shims, the spectral quality is very poor. In (b) the voxel ROI was repositioned in the center of the lesion away from the marker, and a high-quality spectrum showing tCho and other metabolites could be obtained. We now use a carbon coated ceramic marker for this reason. (Figure previously published in NMR Biomed. Haddadin et al 2007).
Including some adipose tissue inside the voxel is commonly unavoidable but leads to sideband artifacts that can hide the tCho peak. A technique called TE averaging has also been shown to reduce artifacts in breast spectra (25). Another alternative is to use lipid suppression to reduce the large 1.3 ppm lipid resonance. (21,30,31). This approach will eliminate sidebands but if lipids are contained in the voxel this will lead to a partial volume effect. This can artificially increase tCho when the water/fat ratio is less than 2. One must readjust the voxel placement to reduce adipose tissues and this can be difficult in irregularly shaped breast lesions.
A variety of methods have been used for analyzing the tCho resonance in breast spectra. The most widely used technique on 1.5T MRI is to simply observe whether or not a resonance is present at 3.2 ppm. Most researchers assume if the tCho peak is visible that this indicates malignancy. A more objective method is to measure the SNR of the region around the suspected tCho resonance, and if it is greater than a pre-defined threshold (SNR >2) then the spectrum is considered positive for tCho. Both of these methods simply determine if a resonance is detectable, which is assumed to be a malignant indicator. The problem with this method is that choline is measured in normal and benign tissues (e.g., fibroadenomas) on higher field MRI scanners (3T, 4T). Quantitative methods have been developed that calculate a numerical concentration of all choline containing compounds in a voxel (26). The area under the 3.2 ppm tCho resonance in the frequency domain is proportional to the number of 1H atoms resonating at that frequency. Quantitative spectral analysis consists of estimating the signal amplitudes of various metabolites and concentrating the signal amplitude using a referencing strategy (32–36). Gadolinium-based contrast agents can also affect relaxation rates and cause a small increase in spectral line widths due to magnetic susceptibility changes, but these effects are relatively small (38–41).
Clinical Applications of MRI/MRS
Diagnostic MRS
The most widely used application of breast MRS is for diagnosing suspicious breast lesions which enhance on MRI. There have been multiple publications from 1.5T showing sensitivities of 70–100% and specificities of 67–100% (27–29, 41–44, 46). A retrospective review combining the results of 5 of the 8 studies showed a sensitivity and specificity of 83% and 85%. The ability of numerous institutions with varying MRI/MRS systems and different measuring techniques demonstrates that breast MRS is clinically practical and useful to a breast imager. These studies all have used the detection of tCho by visual inspection of a 3.2 ppm peak or a threshold SNR to determine if tissue within the voxel is cancerous. The problem with these methods is that the use of delectability of tCho as a cancer biomarker assumes a constant sensitivity across all measurements. In reality, variations in pulse sequences, MR systems, breast coils, and voxel sizes could all potentially affect these findings. A recent report compared breast MRI/MRS at 3T and 1.5T and reported that tCho could be detected in smaller cancers at 3T than at 1.5T (19). tCho can be detected in healthy lactating subjects at 1.5T (27, 29, 41) and also in normal breast tissues at higher field strengths.
A fast computer analysis (CAD) of dynamic contrast enhancement MRI (DCE-MRI) would help voxel placement greatly, although this would have to be within the first few minutes after contrast uptake. A recent study by Meisamy et al.(8,12) showed that by adding in vivo quantitative 1H MR spectroscopy, there was improved diagnostic accuracy of the breast MR interpretation by all expert radiologists in an observer performance study at 4 T. This study shows the promise of improving sensitivity and specificity in interpreting breast MRI/MRS cases. With improvement in field strength, breast coils, software sequencing and faster CAD, MRI/MRS may become useful as an adjunct to all breast MRI studies.
Monitoring treatment response
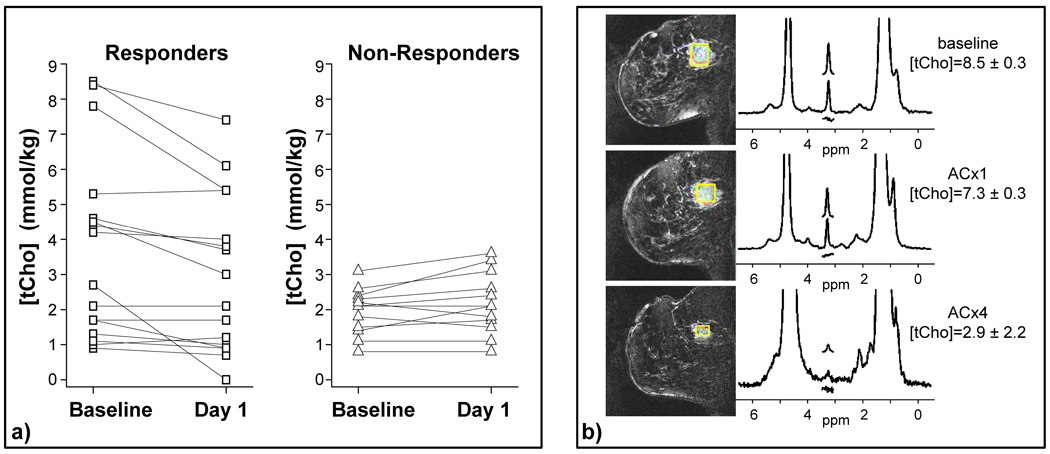
Breast MRI/MRS can be used to evaluate treatment response to chemotherapy. The clinical principle is that increased tCho reflects aberrant metabolism of tumor cells and cell viability, and if the treatment is effective, a decrease in the tCho concentration will be seen before there is a detectable change in the tumor’s size, vascularity and morphological measurements. Multiple studies showing decreased tCho after therapy indicate a response to the chemotherapy. These results would suggest that the decrease in tCho measured 24–48 hours after the first dose of chemotherapy could serve as an early indicator of clinical response to treatment for locally advanced breast cancer (figure 3). Most of this work was performed at higher field strengths (3T and 4T); however, several clinical studies at 1.5T MR have shown mixed results (35,37,46). The variation in results may in part be due to differences in the timing of the post-therapy MR measurement, and further studies are needed.
Figure 3.
Monitoring response to treatment with 4 T quantitative breast MRS. This is an update of findings previously reported in Meisamy et al. (11). These data include 28 patients measured with 4 T breast MRI/MRS before the start of chemotherapy, 1 day after the first dose of therapy, and after the complete course of treatment. The tCho measurements are shown for the baseline and day-1 measurements in (a): 75% of the objective responders showed a decrease in tCho at day 1 after therapy, whereas 92% of non-responders showed no change or an increase at the same time point. (b) An example of an objective responder, showing decreased tCho at day 1, and a clear anatomical response by the end of therapy (ACx4). (Figure previously published in NMR Biomed. Haddadin et al 2007).
Meisamy et al. (11,12) used post-treatment measurement of tCho concentration one day after treatment (figure 3). It appears that MRS is measuring the acute period of response within the tumor cells (one day after treatment) at which time the size and morphological changes are small. Note that the ability to measure tCho decreases as tumors shrink; a total responder may show no contrast uptake as well as no measurable tCho. Higher fields and more sensitive coils should enable tCho measurements in smaller voxels. This may help determine biomarker response in smaller breast cancers. As lesion size decreases during therapy, variations in voxel placement and partial volume averaging of adipose tissue becomes more of a problem.
Ultra High Field MRS
Higher field MRI scanners can increase sensitivity and spectral resolution. The sensitivity of 1H MRS spectroscopy increases linearly with increased field strength (8,9), so smaller voxels can be used. With advanced magnetic field (B0) shimming techniques, the higher field gives an increase in spectral resolution, potentially allowing more chemical resonances to be resolved. For example, at 4 T the increased SNR and spectral resolution often allows the detection of creatine and taurine resonances, although the SNR is substantially lower than that of tCho. At these higher field strengths one may obtain additional metabolic information from healthy tissues. There are additional challenges associated with higher field strengths: 1) B0 shimming is more difficult; 2) radiofrequency (B1) inhomogeneities make coil designs more complicated; 3) relaxation rate constants change; and 4) longer T1 values require longer TR’s. At higher field strengths, quantitative analyses will be required as tCho resonance can be detected in normal breast tissues. There are newer techniques available to solve all these problems so that the benefit of higher field strengths MRS can be used to improve the clinical value of MRS.
Conclusion
Proton spectroscopy can provide useful clinical information of patients with breast disease. With improvement in quantitative MRS and high field MR systems, breast imagers and researchers have the ability to improve the detection and characterization of breast cancer. By using a combination of new techniques including DCE, diffusion, and tCho MRS, one can develop measurements of breast tumor tissue and use this information as a biomarker for tumor diagnosis and treatment response.
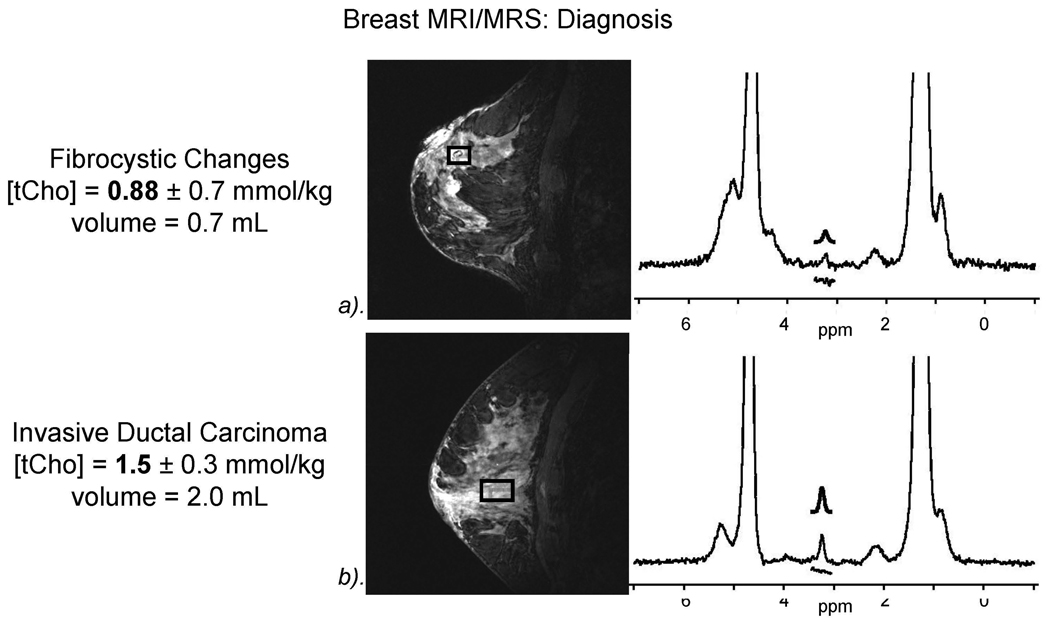
Figure 2.
Breast MRI/MRs showing increased diagnostic accuracy which helps avoid unnecessary biopsies. a). Example of benign fibrocystic breast changes with tCho=.88 mmol/kg; b). Example of IDC with elevated tCho 1.5 mmol/kg.
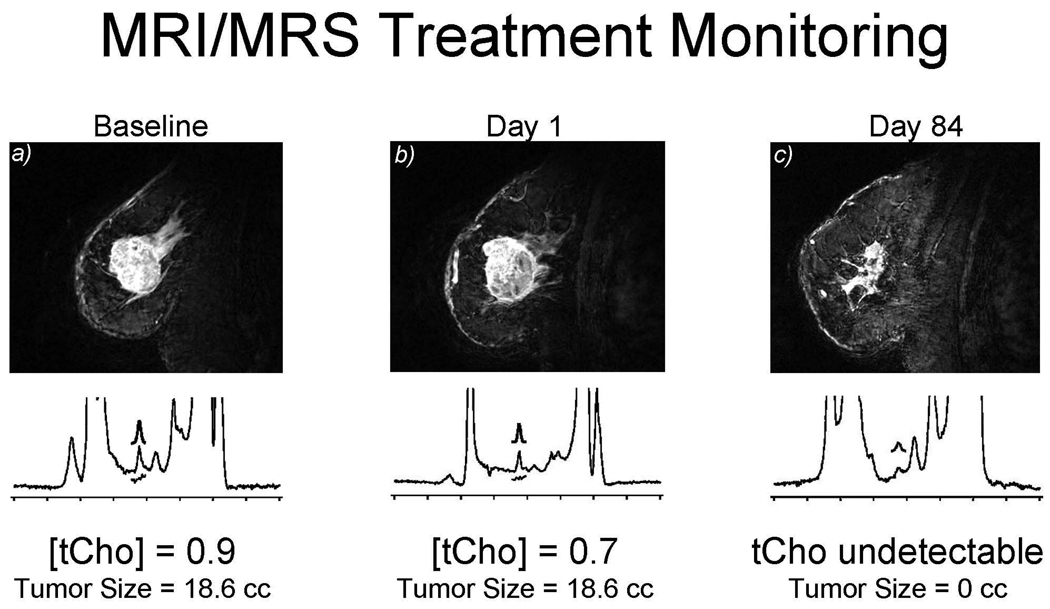
Figure 4.
Baseline before treatment showing 0.9 mm mmol/kg. After 1 dose of adriamycin-cytoxan (AC), the tCho decreases to 0.7. Note that the tumor does not show a change in size. After 4 AC treatments at day 84, no choline is detectable in the lesion. This illustrates early response at 24-hours. Clinical oncologists could predict at 24-hours that this tumor would respond to chemotherapy.
Acknowledgement
We would like to acknowledge the following grants from NIH (grants CA92004, CA120509, RR08079, and RR00400) and the DOD Breast Cancer Research program (DAMD 17-01-1-0331).
Footnotes
Publisher's Disclaimer: This is a PDF file of an unedited manuscript that has been accepted for publication. As a service to our customers we are providing this early version of the manuscript. The manuscript will undergo copyediting, typesetting, and review of the resulting proof before it is published in its final citable form. Please note that during the production process errors may be discovered which could affect the content, and all legal disclaimers that apply to the journal pertain.
References
- 1.Ries LAG, Eisner MP, Kosary CL, et al., editors. SEER Cancer Statistics Review 1975–2002. Bethesda, MD: National Cancer Institute; http://seer.cancer.gov/csr/1975_2002/, based on November 2004 SEER data submission, posted online 2005. [Google Scholar]
- 2.Aboagye EO, Bhujwalla ZM. Malignant transformation alters membrane choline phospholipid metabolism of human mammary epithelial cells. Cancer Res. 1999;59(1):80–84. [PubMed] [Google Scholar]
- 3.Podo F. Tumour phospholipid metabolism. NMR Biomed. 1999;12(7):413–439. doi: 10.1002/(sici)1099-1492(199911)12:7<413::aid-nbm587>3.0.co;2-u. [DOI] [PubMed] [Google Scholar]
- 4.Ramirez de Molina A, Rodriguez-Gonzalez A, Lacal JC. Ras signalling to ChoK inhibitors: a further advance in anticancer drug design. Cancer Lett. 2004;206(2):137–148. doi: 10.1016/j.canlet.2003.08.031. [DOI] [PubMed] [Google Scholar]
- 5.Glunde K, Jie C, Bhujwalla ZM. Molecular causes of the aberrant choline phospholipid metabolism in breast cancer. Cancer Res. 2004;64(12):4270–4276. doi: 10.1158/0008-5472.CAN-03-3829. [DOI] [PubMed] [Google Scholar]
- 6.Guthridge CJ, Stampfer MR, Clark MA, et al. Phospholipases A2 in ras-transformed and immortalized human mammary epithelial cells. Cancer Lett. 1994;86(1):11–21. doi: 10.1016/0304-3835(94)90175-9. [DOI] [PubMed] [Google Scholar]
- 7.Noh DY, Ahn SJ, Lee RA, et al. Over-expression of phospholipase D1 in human breast cancer tissues. Cancer Lett. 2000;161(2):207–214. doi: 10.1016/s0304-3835(00)00612-1. [DOI] [PubMed] [Google Scholar]
- 8.Hoult DI, Phil D. Sensitivity and power deposition in a high-field imaging experiment. J. Magn. Reson. Imaging. 2000;12(1):46–67. doi: 10.1002/1522-2586(200007)12:1<46::aid-jmri6>3.0.co;2-d. [DOI] [PubMed] [Google Scholar]
- 9.Vaughan JT, Garwood M, Collins CM, et al. 7 T vs. 4 T: RF power, homogeneity, and signal-to-noise comparison in head images. Magn. Reson. Med. 2001;46(1):24–30. doi: 10.1002/mrm.1156. [DOI] [PubMed] [Google Scholar]
- 10.Gruetter R, Weisdorf SA, Rajanayagan V, et al. Resolution Improvements in in vivo 1H NMR spectra with increased magnetic field strength. J. Magn. Reson. 1998;135:260–264. doi: 10.1006/jmre.1998.1542. [DOI] [PubMed] [Google Scholar]
- 11.Meisamy S, Bolan PJ, Baker EH, et al. Neoadjuvant chemotherapy of locally advanced breast cancer: predicting response with in vivo (1)H MR spectroscopy: a pilot study at 4 T. Radiol. 2004;233(2):424–431. doi: 10.1148/radiol.2332031285. [DOI] [PubMed] [Google Scholar]
- 12.Meisamy S, Bolan PJ, Baker EH, et al. Adding in vivo quantitative 1H MR spectroscopy to improve diagnostic accuracy of breast MR imaging: preliminary results of observer performance study at 4.0 T. Radiol. 2005;236(2):465–475. doi: 10.1148/radiol.2362040836. [DOI] [PubMed] [Google Scholar]
- 13.Kurhanewicz J, Swanson MG, Nelson SJ, et al. Combined Magnetic resonance imaging and spectroscopic imaging approach to molecular imaging of prostate cancer. J of Mag Reson Imag. 2002;16:451–463. doi: 10.1002/jmri.10172. [DOI] [PMC free article] [PubMed] [Google Scholar]
- 14.Konyer NB, Ramsay EA, Bronskill MJ, et al. Comparison of MR imaging breast coils. Radiol. 2002;222(3):830–834. doi: 10.1148/radiol.2223001310. [DOI] [PubMed] [Google Scholar]
- 15.Zhai X, Kurpad K, Smith M, et al. Breast coil for real time MRI guided interventional device. Proceedings of the 15th Annual ISMRM; Berlin. 2007. p. 445. [Google Scholar]
- 16.Giaquinto RO, McKenzie C, Sodickson DK, et al. A 28 channel bi-lateral breast array for accelerated MR imaging. Proceedings of the 14th Annual ISMRM; Seattle. 2006. p. 423. [Google Scholar]
- 17.Bottomley PA. Selective volume method for performing localized NMR spectroscopy. 4,480,228 US Patent. 1984
- 18.Ordidge RJ, Bendall MR, Gordon RE, et al. Magnetic Resonance in Biology and Medicine. New Delhi: McGraw-Hill; 1985. Volume selection for in vivo biological spectroscopy; pp. 387–397. [Google Scholar]
- 19.Frahm J, Merboldt KD, Hanicke W. Localized proton spectroscopy using stimulated echoes. J. Magn. Reson. 1987;72:502–508. doi: 10.1002/mrm.1910170113. [DOI] [PubMed] [Google Scholar]
- 20.Garwood M, DelaBarre L. The return of the frequency sweep: designing adiabatic pulses for contemporary NMR. J. Magn. Reson. 2001;153(2):155–177. doi: 10.1006/jmre.2001.2340. [DOI] [PubMed] [Google Scholar]
- 21.Jacobs MA, Barker PB, Bottomley PA, et al. Proton magnetic resonance spectroscopic imaging of human breast cancer: a preliminary study. J. Magn. Reson. Imaging. 2004;19(1):68–75. doi: 10.1002/jmri.10427. [DOI] [PubMed] [Google Scholar]
- 22.Su MY, Baik HM, Yu HJ, et al. Comparison of choline and pharmacokinetic parameters in breast cancer measured by MR spectroscopic imaging and dynamic contrast enhanced MRI. Technol. Cancer Res. Treat. 2006;5(4):401–410. [PubMed] [Google Scholar]
- 23.Hu J, Xuan Y, Latif Z, et al. An improved 1H magnetic resonance spectroscopic imaging technique for the human breast. Proceedings of the 13th Annual ISMRM; Miami. 2007. p. 134. [DOI] [PubMed] [Google Scholar]
- 24.Jacobs MA, Smith M, Khouri N, et al. Three-dimensional proton MR spectroscopic imaging of human breast lesions. Proceedings of the 14th Annual ISMRM; Seattle. 2006. p. 1795. [Google Scholar]
- 25.Bolan PJ, delaBarre L, Baker EH, et al. Eliminating spurious sidebands in 1H MRS of breast lesions. Magn Reson Med. 2002;48:215–222. doi: 10.1002/mrm.10224. [DOI] [PubMed] [Google Scholar]
- 26.Bolan PJ, Meisamy S, Baker EH, et al. in vivo quantification of choline compounds in the breast with 1H MR spectroscopy. Magn Reson Med. 2003;50:1134–1143. doi: 10.1002/mrm.10654. [DOI] [PubMed] [Google Scholar]
- 27.Kvistad KA, Bakken IJ, Gribbestad IS, et al. Characterization of neoplastic and normal human breast tissues with in vivo 1H MR spectroscopy. J. Magn. Reson. Imaging. 1999;10:159–164. doi: 10.1002/(sici)1522-2586(199908)10:2<159::aid-jmri8>3.0.co;2-0. [DOI] [PubMed] [Google Scholar]
- 28.Yeung DKW, Cheung HS, Tse GMK. Human breast lesions: characterization with contrast-enhanced in vivo proton MR spectroscopy: initial results. Radiology. 2001;220:40–46. doi: 10.1148/radiology.220.1.r01jl0240. [DOI] [PubMed] [Google Scholar]
- 29.Stanwell P, Gluch L, Clark D, et al. Specificity of choline metabolites for in vivo diagnosis of breast cancer using 1H MRS at 1.5 T. Eur. Radiol. 2005;15(5):1037–1043. doi: 10.1007/s00330-004-2475-1. [DOI] [PubMed] [Google Scholar]
- 30.Star-Lack JM, Adalsteinsson E, Gold GE, et al. Motion correction and lipid suppression for 1-H magnetic resonance spectroscopy. Magn. Reson. Med. 2000;43:325–330. doi: 10.1002/(sici)1522-2594(200003)43:3<325::aid-mrm1>3.0.co;2-8. [DOI] [PubMed] [Google Scholar]
- 31.Baik HM, Su MY, Yu H, et al. Quantification of choline-containing compounds in malignant breast tumors by 1H MR spectroscopy using water as an internal reference at 1.5 T. MAGMA. 2006;19(2):96–104. doi: 10.1007/s10334-006-0032-4. [DOI] [PubMed] [Google Scholar]
- 32.Baik HM, Su MY, Yu H, et al. Quantification of choline-containing compounds in malignant breast cancer by 1H single-voxel MR spectroscopy at 1.5T. Proceedings of the 14th Annual ISMRM; Seattle. 2006. p. 582. [Google Scholar]
- 33.Klomp DW, Veltman J, Boetes C, et al. Robust quantification of choline compounds in the breast at 1.5T using prior knowledge and optimized detection methods. Proceedings of the 13th Annual ISMRM; Miami. 2005. p. 1854. [Google Scholar]
- 34.van den Boogaart A. A User’s Guide to the Magnetic Resonance User Interface Software Package. Delft: Delft Technical University Press; 1997. [Google Scholar]
- 35.Tan PC, Lowry M, Manton DJ, et al. Evaluation of choline concentrations in malignant breast lesions in predicting response to neoadjuvant chemotherapy. Proceedings of the 14th Annual ISMRM; Seattle. 2006. p. 574. [Google Scholar]
- 36.Provencher SW. Automatic quantitation of localized in vivo 1H spectra with LCModel. NMR Biomed. 2001;14(4):260–264. doi: 10.1002/nbm.698. [DOI] [PubMed] [Google Scholar]
- 37.Baik HM, Chen JH, Yu H, et al. Quantitative MR spectroscopy to monitor treatment response of breast cancer to neoadjuvant chemotherapy. Proceedings of the 15th Annual ISMRM; Berlin. 2007. p. 556. [Google Scholar]
- 38.Sijens PE, adBM J, Nowak PJ, et al. 1H chemical shift imaging reveals loss of brain tumor choline signal after administration of Gd-contrast. Magn. Reson. Med. 1997;37(2):222–225. doi: 10.1002/mrm.1910370214. [DOI] [PubMed] [Google Scholar]
- 39.Taylor JS, Reddick WE, Kingsley PB, et al. Proton MRS after gadolinium contrast agent. Proceedings of the 3rd Annual Meeting ISMRM; Nice, France. 1854. p. 1995. [Google Scholar]
- 40.Lin A, Ross BD. The effect of gadolinium on quantitative short-echo time single voxel MRS of treated and untreated brain tumors. Proceedings of the 8th Annual Meeting ISMRM; Denver, CO. 2000. p. 390. [Google Scholar]
- 41.Smith JK, Kwock L, Castillo M. Effects of contrast material on single-volume proton MR spectroscopy. Am. J. Neuroradiol. 2000;21(6):1084–1089. [PMC free article] [PubMed] [Google Scholar]
- 42.Jagannathan NR, Kumar M, Seenu V, et al. Evaluation of total choline from in-vivo volume localized proton MR spectroscopy and its response to neoadjuvant chemotherapy in locally advanced breast cancer. Br. J. Cancer. 2001;84(8):1016–1022. doi: 10.1054/bjoc.2000.1711. [DOI] [PMC free article] [PubMed] [Google Scholar]
- 43.Cecil KM, Schnall MD, Siegelman ES, et al. The evaluation of human breast lesions with magnetic resonance imaging and proton magnetic resonance spectroscopy. Breast Cancer Res. Treat. 2001;68(1):45–54. doi: 10.1023/a:1017911211090. [DOI] [PubMed] [Google Scholar]
- 44.Kim JK, Park SH, Lee HM, et al. In vivo 1 H-MRS evaluation of malignant and benign breast diseases. Breast. 2003;12(3):179–182. doi: 10.1016/s0960-9776(03)00012-2. [DOI] [PubMed] [Google Scholar]
- 45.Huang W, Fisher PR, Dulaimy K, et al. Detection of breast malignancy: diagnostic MR protocol for improved specificity. Radiol. 2004;232(2):585–591. doi: 10.1148/radiol.2322030547. [DOI] [PubMed] [Google Scholar]
- 46.Danishad KA, Seenu V, Jagannathan NR. 2D MRSI in locally advanced breast cancer: assessment of tumor response in patients undergoing neo-adjuvant chemotherapy. Proceedings of the 15th Annual ISMRM; Berlin. 2007. p. 557. [Google Scholar]
- 47.Bartella L, Morris EA, Dershaw DD, et al. Proton MR spectroscopy with choline peak as malignancy marker improves positive predictive value for breast cancer diagnosis: Preliminary study. Radiol. 2006;239(3):686–692. doi: 10.1148/radiol.2393051046. [DOI] [PubMed] [Google Scholar]


