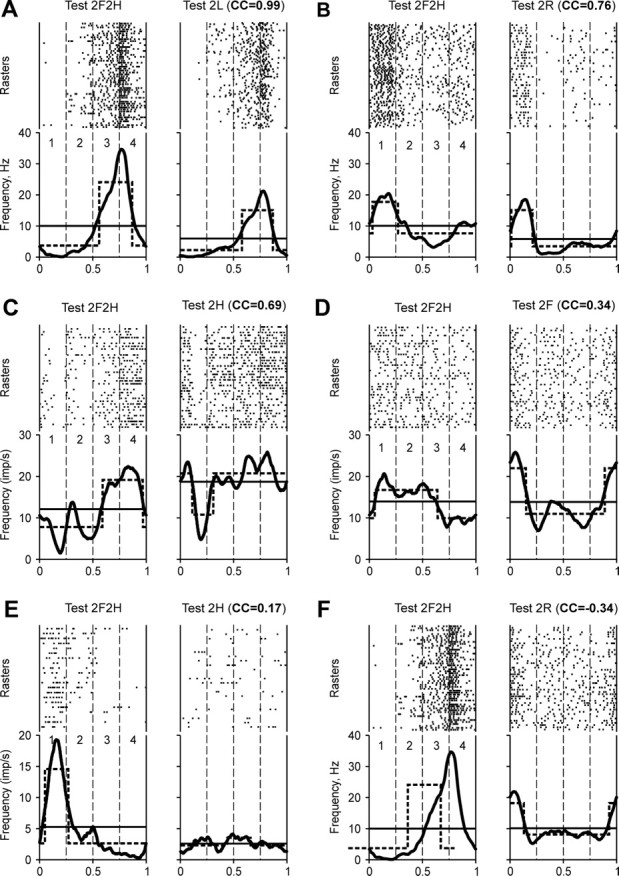
Figure 10.

Comparison of modulation patterns of individual neurons during different locomotor tasks. For each test, the raster and the histogram (thick line) of the neuron activity are shown. Cycle periods (1–4) were taken from hindlimb movements (A, C, D, F) and forelimb movements (B, E). The hatched lines show the best two-level rectangular approximations of the histograms, with the burst period (upper level) and interburst period (lower level). The thin lines give the mean spiking frequency in a test. The test type and the CC between the phase histograms obtained in the test and in Test 2F2H (control) are indicated. The examples are taken from five neurons (the same neuron in A and F). They were classified (see Figs. 11, 12) as 1-4 (A, F), 1-1 (B), 1-3 (C, D), and 1-2 (E).
