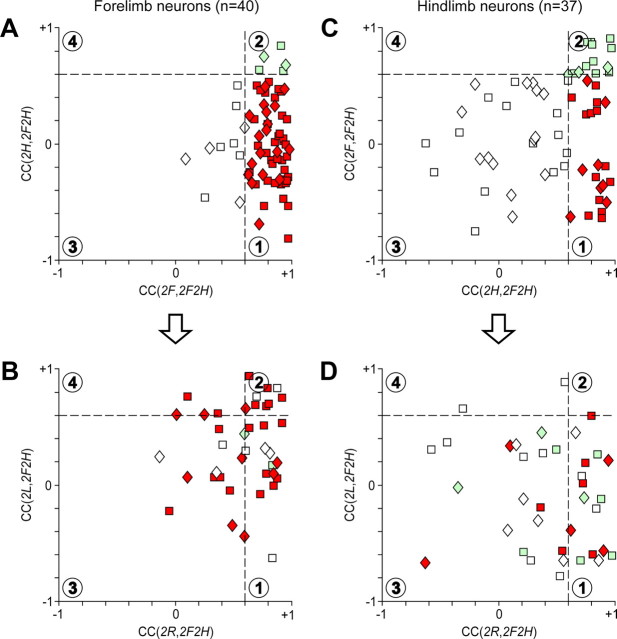
Figure 11.
Similarities and distinctions in modulation patterns of neurons in different locomotor tasks. In the scatter diagrams, the x and y values of each point show the CC for individual forelimb neurons (A, B) and hindlimb neurons (C, D). A, Abscissa is the CC of tests (2F, 2F2H), and ordinate is the CC of tests (2H, 2F2H). B, Abscissa is the CC of tests (2R, 2F2H), and ordinate is the CC of tests (2L, 2F2H). C, Abscissa is the CC of tests (2H, 2F2H), and ordinate is the CC of tests (2F, 2F2H). D, Abscissa is the CC of tests (2R, 2F2H), and ordinate is the CC of tests (2L, 2F2H). A similarity between the activity patterns was considered significant for CC > 0.6. Two interrupted lines at CC = 0.6 divide the whole plot area into four parts (1–4, indicated by numbers in circles) and all neurons into corresponding groups. In A and C, white squares indicate the neurons with CC > 0.6 in none of the tests (area 3). Green squares indicate the neurons with CC > 0.6 in both tests (area 2). Red squares indicate the neurons with CC > 0.6 only in Test 2F (A) or only in Test 2H (C) (area 1). The color for each point in plots B and D was taken from plots A and C, respectively. This allows for further divisions of each group of neurons into four subgroups (1–4) based on their coordinates on the B and D plots. Data for the neurons that were identified as PTNs are shown with squares; data for unidentified neurons are shown with diamonds. All revealed subgroups of neurons contained both PTNs and unidentified neurons.

