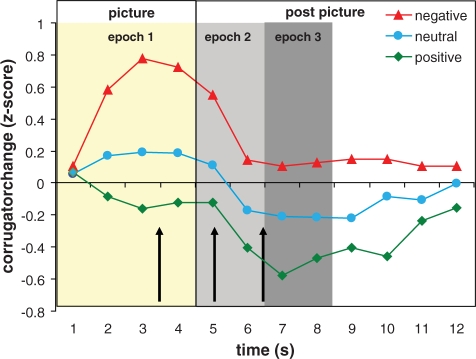
Fig. 1.
Baseline-corrected second-by-second EMG activity measured over the brow region (corrugator supercilii muscle, log-transformed, z-scored) for each of the picture valences across a 12 s period. Corrugator EMG was aggregated over three distinct epochs: the first 4 s denote the epoch during picture presentation marked in off-white, the first grey area marks the first 2 s epoch after picture offset, the second darker grey area marks the second 2 s epoch after picture offset. The three startle probe times are indicated by the black arrows.

