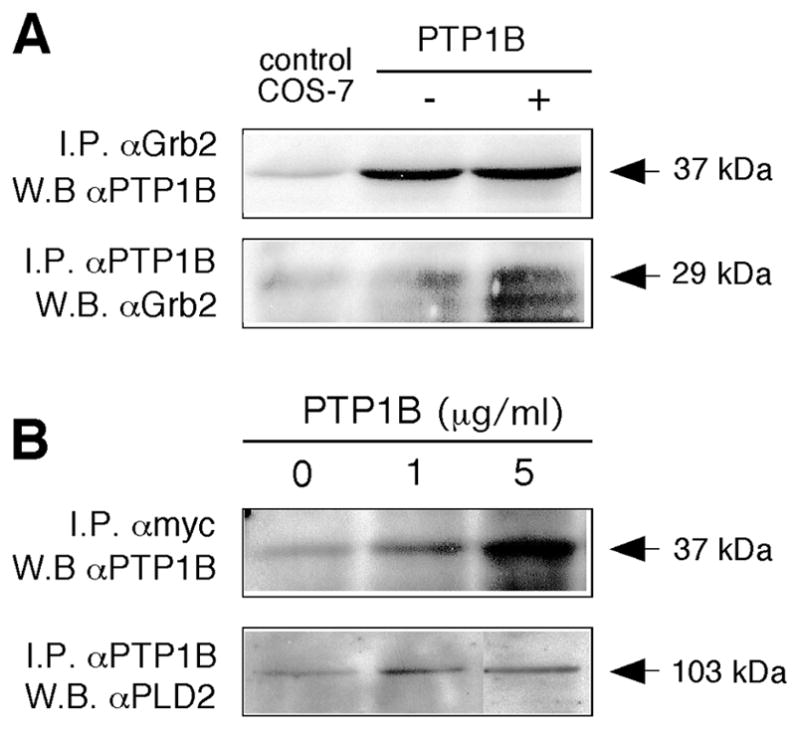
Figure 9. Co-immunoprecipitation of PTP1B and Grb2 and of PLD2 and PTP1B.

(A) Upper panel: Immunoprecipitation with anti-Grb2 antibodies and immunoblotting with anti-PTP1B. Shown in the is the region of the immunoblots where PTP1B localizes (37 kDa). “Control COS-7” refers to plain COS-7 cells. Lower panel: Immunoprecipitation with anti-PTP1B antibodies and immunoblotting with anti-Grb2. Shown is the region of the immunoblots where Grb2 localizes (29 kDa). (B) Upper panel: Immunoprecipitation with anti-myc antibodies and immunoblotting with anti-PTP1B. Shown is the region of the immunoblots where PTP1B localizes (37 kDa). Lower panel: Immunoprecipitation with anti-PTP1B antibodies and immunoblotting with anti-PLD2. Shown is the region of the immunoblots where PLD2 localizes (103 kDa) of an experiment typical among a total of three.
