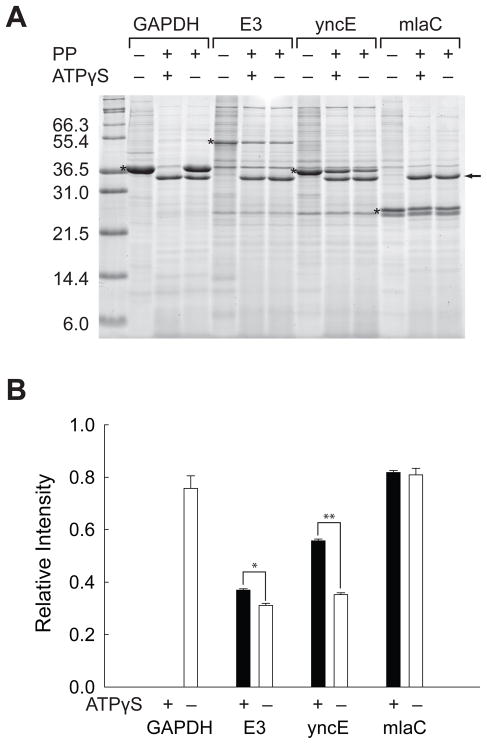
Figure 3.
Validation of the proteomic screen with recombinant proteins. (A) Pulse proteolysis of recombinant GAPDH, E3, yncE and yrbC in E. coli lysates with and without 1.0 mM ATPγS. PP stands for pulse proteolysis. The bands corresponding to over-expressed proteins are marked with asterisks. The bands corresponding to thermolysin are marked with an arrow. (B) Relative intensities of remaining proteins after pulse proteolysis with (black bar) and without (white bar) 1.0 mM ATPγS. The band intensities of over-expressed proteins on the gel shown in Figure 3A were quantified and expressed as ratios to the band intensities of the undigested proteins on the same gel. The error bars indicate the standard deviation of triplicate experiments. *p = 0.0013, **p < 0.0001.

