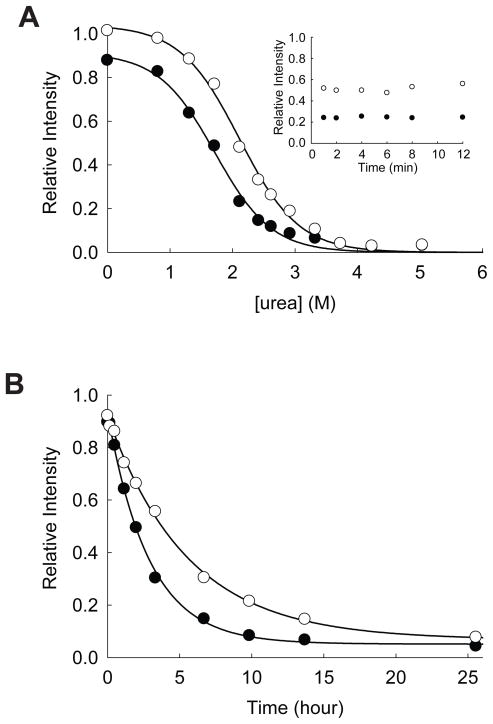
Figure 7.
Effect of ATP on the stability of yncE. (A) Equilibrium unfolding of yncE in urea probed by pulse proteolysis with (○) and without (●) 1.0 mM ATPγS. Relative intensities are the ratio of the band intensities of remaining proteins after pulse proteolysis to the band intensity of undigested protein. The apparent Cm values were determined by fitting the relative intensities to Eq. 1. INSET: Prolonged incubation of yncE with 0.2 mg/mL thermolysin in 1.9 M urea with (○) and without (●) 1.0 mM ATPγS. (B) Unfolding of yncE in 3 M urea with (○) and without (●) 1.0 mM ATPγS monitored by pulse proteolysis. Unfolding kinetic constants were determined by fitting the relative intensities to a first-order rate equation.

