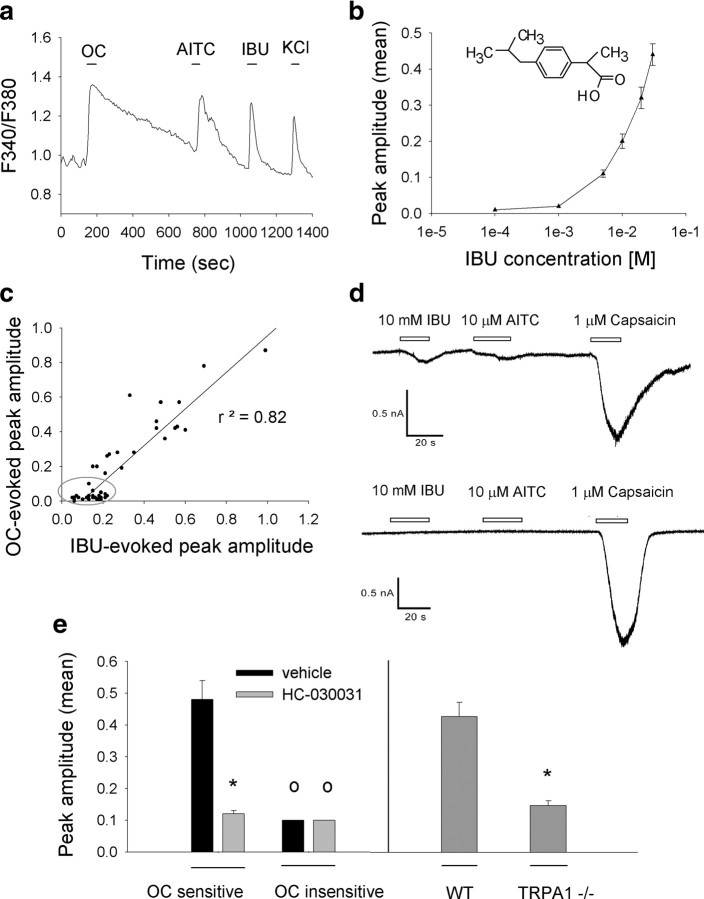
Figure 3.
Ibuprofen excites trigeminal neurons through TRPA1 channel activation. a, IBU (10 mm) evokes calcium influx into cultured rat trigeminal neurons as assessed by fura-2 ratiometric imaging (F340/F380). In a, the representative trace of one neuron shows that cells sensitive to IBU are also activated by OC (5 μm) and AITC (50 μm). The horizontal bars indicate the duration of compound application. The 40 mm KCl solutions were applied as a control for neuronal activity. b, Dose–response curves for IBU-evoked responses in rat trigeminal neurons. The high IBU concentrations (>30 mm) required to complete the dose–response curve did not permit to reach saturation, as the increase of the ionic strength and osmolarity of the medium affected cell viability. The curve was generated by averaging the peak amplitude of the responses (fura-2 ratio) of all the cells (n > 60 per data point). IBU chemical structure is indicated on the graph. c, Sensitivity to OC and IBU is correlated in sensory neurons. The scatterplot displays relationship between 10 mm IBU and 5 μm OC-evoked responses in trigeminal neurons. Each dot represents intracellular calcium increase in a single cell. Small calcium influxes induced by IBU (gray circle) were observed in all the examined cells (n = 56) insensitive to OC. d, Representative whole-cell current traces generated in DRG neurons, in the presence of extracellular Ca2+. Vh = −60 mV. Ten millimolar IBU elicited current responses in sensory neurons expressing TRPA1 (AITC sensitive) (top) but not in sensory neurons lacking the TRPA1 channel (AITC insensitive) (bottom). e, TRPA1 is required for trigeminal neuron response to IBU. HC-030031 (HC) (20 μm) decreased 10 mm IBU-evoked responses down to the calcium influx measured in all the OC-insensitive cells (examined cells, n = 55) (left) and TRPA1-deficient trigeminal neurons display only small nonspecific IBU-evoked calcium influx (n = 128 from 5 mice) (right) similar to those observed in the OC-insensitive cells (left). *p < 0.05 versus control [vehicle for left panel; wild-type (WT) for right panel], °p < 0.05 versus OC-sensitive cells in vehicle solution, t test. Error bars indicate SEM.

