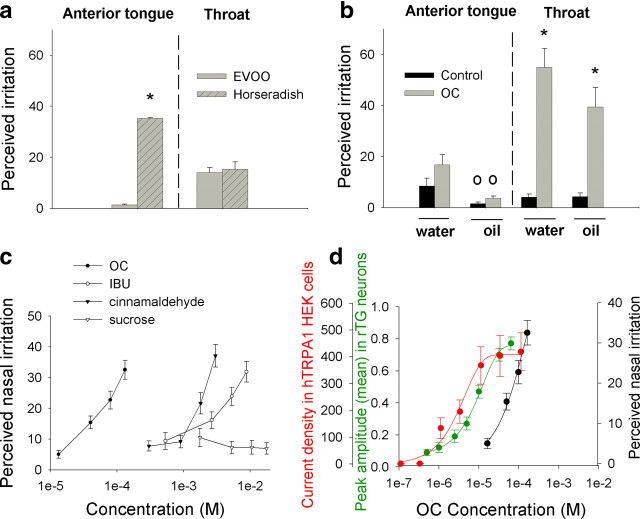
Figure 5.
The human throat and nose are more sensitive than the anterior tongue to OC. a, Irritation perceived on the anterior tongue after its immersion in either 25 ml of an extra-virgin olive oil (EVOO) (OC source) or a horseradish solution (AITC source), and irritation perceived in the throat after swallowing 3.5 ml of the same solutions (subjects = 12). *p < 0.05 versus olive oil, t test. b, Irritation perceived either on the anterior tongue after its immersion in 25 ml of solution, or in the throat after swallowing 3.5 ml of the same solutions (subjects = 13). The four solutions tested were as follows: water plus 0.25% ethanol, water plus 0.25% ethanol plus 660 μm OC, corn oil, and corn oil plus 660 μm OC. The addition of 0.25% ethanol was required to dissolve OC in water. *p < 0.05 versus control, °p < 0.05 versus water, t test. c, Irritation perceived in the nares after application of OC, IBU, trans-cinnamaldehyde, and sucrose. Each stimulus dissolved in saline solution plus 0.1% ethanol was applied in the subject nares with a nasal sprayer device (volume, 0.3 ml). The four concentrations used for each stimulus were tested in independent sessions and in duplicate (subjects = 11). Mean intensity rating of saline solution plus 0.1% ethanol alone was similar to the sucrose solution (=5.14). All perceived irritation ratings were performed on a gLMS scale. Values represent mean of gLMS ratings ± SEM. d, OC activation curves in cultured rat trigeminal neurons (green) and current density curves of heterologously expressed hTRPA1 channels in HEK 293 cells (red) compared with the perceived intensity curve of the compound in the nares (black). Error bars indicate SEM.

