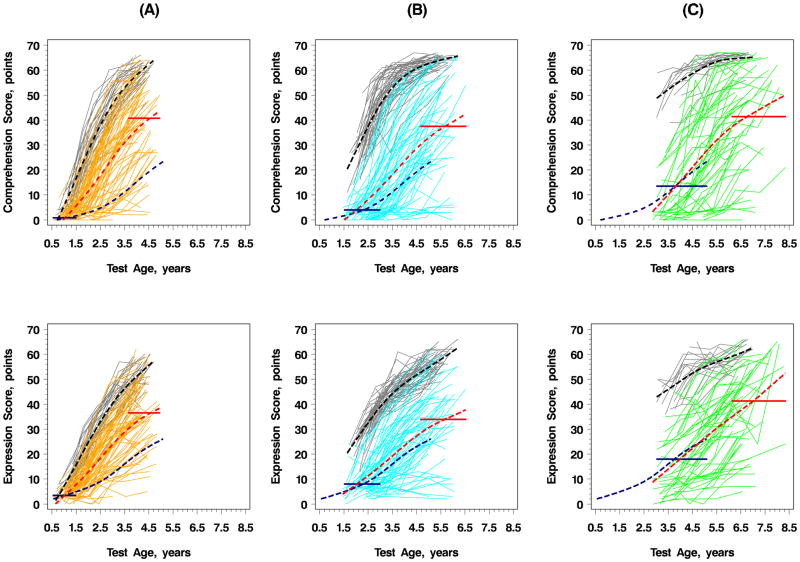
Figure 1.
Developmental Trajectories of RDLS Raw Scores of Comprehension and Expression Grouped by Age At Baseline
Hearing children in gray (A) <18 months, (B) 18–36 months, and (C) >36 months; mean trajectories of sub-groups by age of enrollment in black. Children undergoing CI: (A) Implant age <18 months in orange, (B) 18–36 months in blue, (C) >36 months in green. Mean trajectories for respective age group in red dash. Mean score after 3 years designated by horizontal line, the width of which spans the age range at time of testing. Mean scores established by baseline (pre-CI) scores of children undergoing CI are shown in each plot in navy blue dash.

