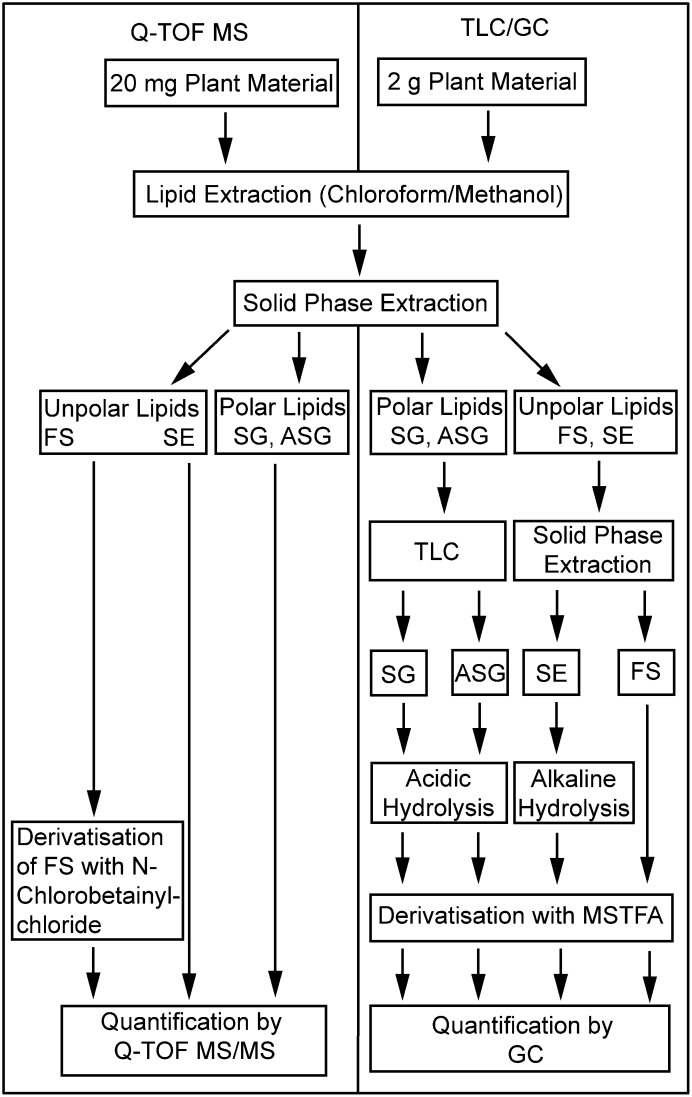
Fig. 1.
Flow chart for sterol lipid quantification. Sterol lipids were obtained from ∼2 g of leaf material and, after fractionation by TLC and SPE, were quantified by GC. The direct infusion MS strategy is based on lipid extracts obtained from ∼20 mg of leaf material. Lipids are fractionated by SPE and quantified by Q-TOF MS/MS.

