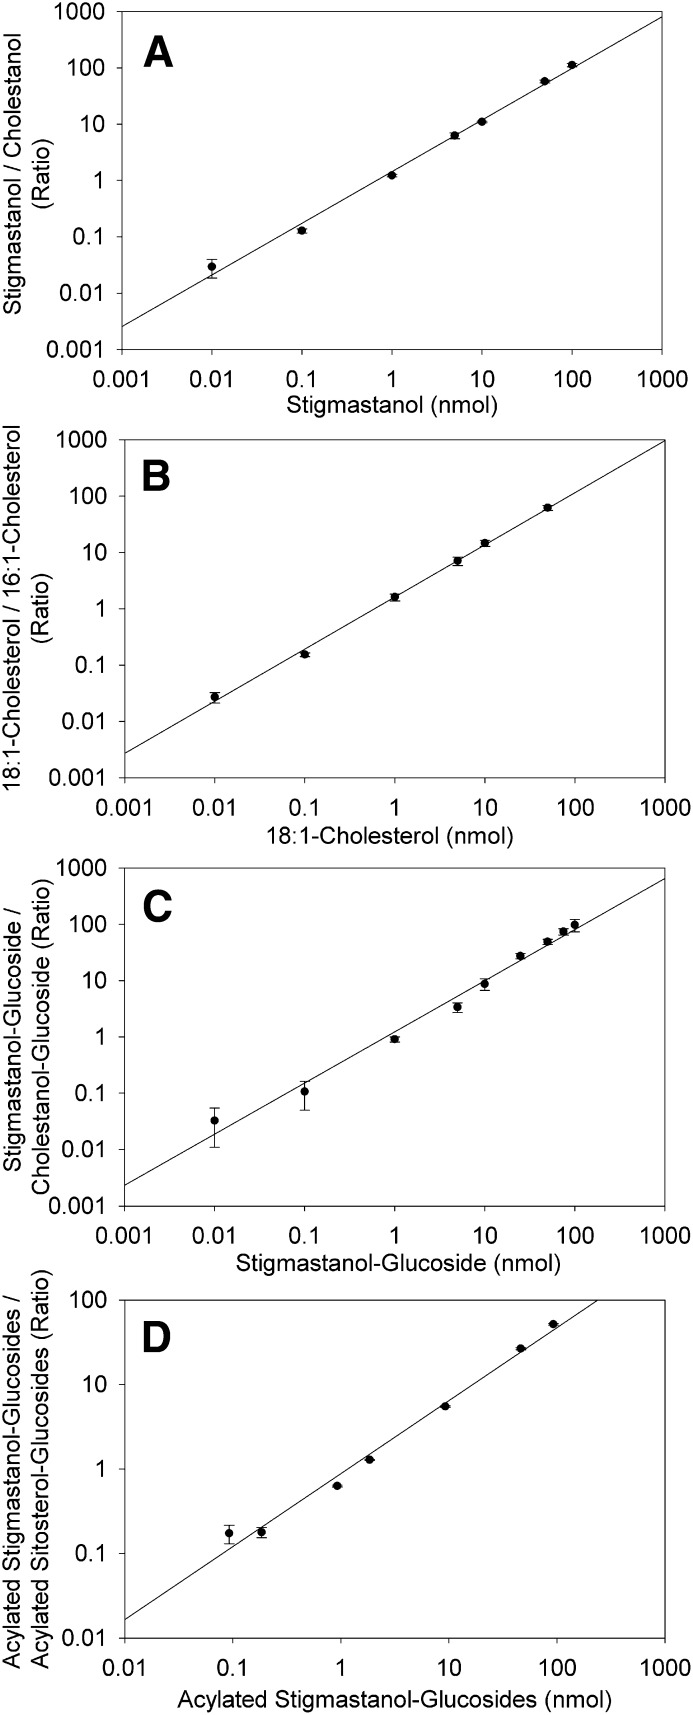
Fig. 5.
Standard curves for sterol lipids. Different amounts of each lipid standard were infused into the Q-TOF mass spectrometer in the presence of a constant amount of an internal standard, and the ratio of the MS/MS signals was plotted against the variable standard content (in nmol per 200 µl). The data show the means ± SD of at least three experiments and regression lines. Axes show logarithmic scaling. A: Standard curve for stigmastanol normalized to cholestanol. B: Standard curve for 18:1-cholesterol normalized to 16:1-cholesterol. C: Standard curve for stigmastanol-Glc normalized to cholestanol-Glc. D: Standard curve for acylated stigmastanol-glucoside normalized to acylated sitosterol-glucoside.

