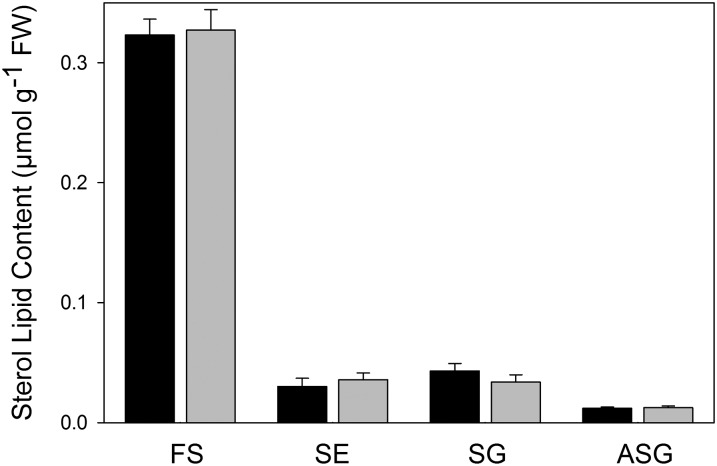
Fig. 7.
Comparison of sterol lipid quantification by Q-TOF MS/MS measurements versus those with TLC/GC. Lipids were isolated from Arabidopsis leaves in the presence of internal standards and fractionated by SPE into nonpolar lipids (FS, SE) and polar lipids (SG, ASG). One aliquot each was analyzed by TLC/GC (black bars) or by Q-TOF MS/MS (gray bars). Bars show means ± SD of four measurements.

