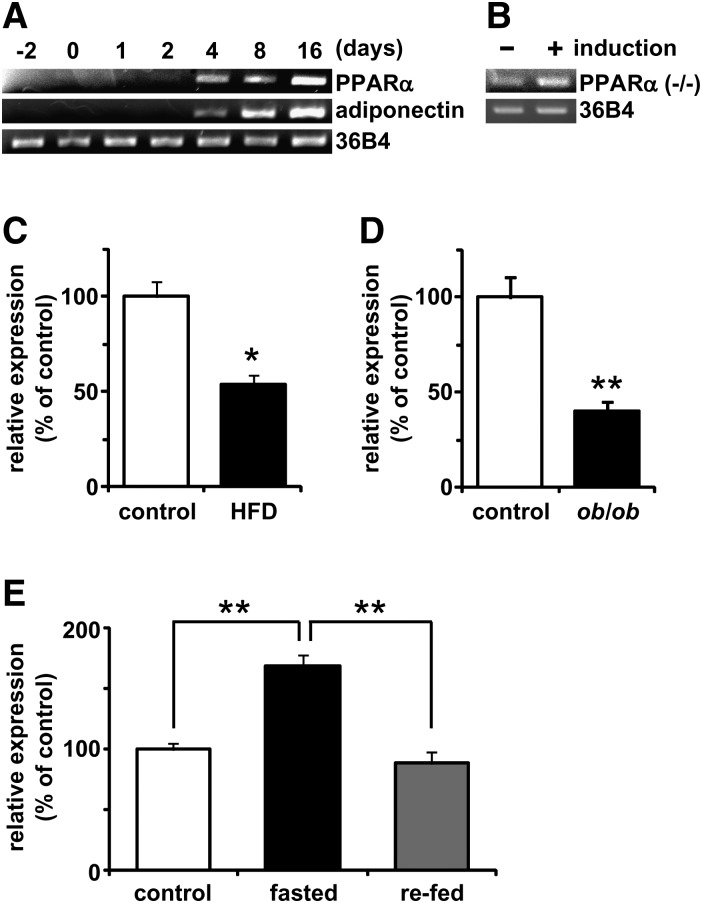
Fig. 2.
mRNA expression levels of PPARα in cultured cells and WAT. A, B: mRNA expression levels of murine PPARα and adiponectin or human PPARα during adipocyte differentiation. 3T3-L1 cells and human multipotent adipose tissue-derived stem cells were harvested at the indicated times after differentiation induction. Semiquantitative PCR conditions are described in “Materials and Methods.” C, D: mRNA expression levels of PPARα in WAT in obese model mice and lean control mice. PPARα mRNA expression levels in C57BL/6 mice fed high-fat diet (HFD) or normal diet (control) for 12 months (C) and in ob/ob mice or lean control mice (D) were quantified by a real-time PCR as described in “Materials and Methods.” E: The mRNA expression levels of PPARα in WAT in C57BL/6 under fed (control), fasted (24 h), and fasted/refed (24 h after refeeding) conditions were quantified by real-time PCR. Data are means ± SEM of 4-6 animals per group. *P < 0.05, **P < 0.01.

