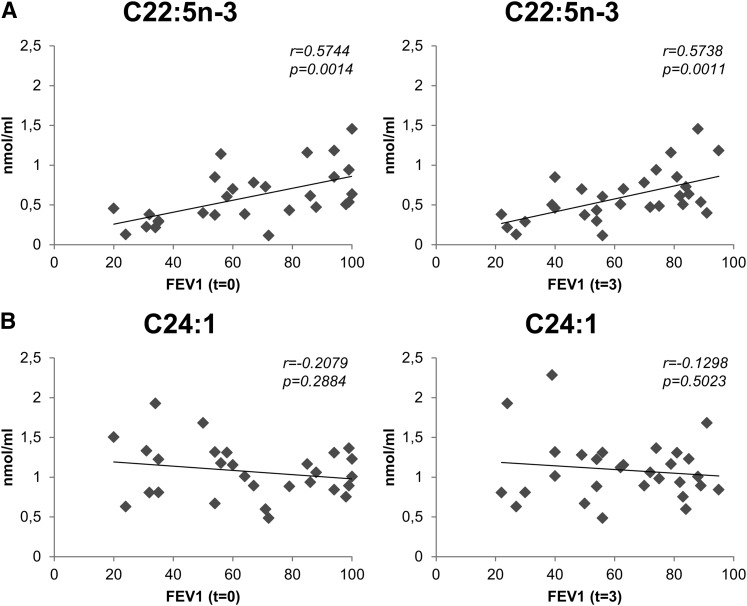
Fig. 1.
Plasma free fatty acids are correlated with FEV1. Scatter plots corresponding to the comparison between plasma levels of two free fatty acids (C22:5n-3 in panel A and C24.1 in panel B), and FEV1 values at t = 0 (left panels) and t = 3 (right panels). C22:5n-3 is positively correlated with FEV1 at both time points, while C24:1 presents no significant correlation (n = 28 for t = 0; n = 30 for t = 3; data corresponding to patient 2 were removed in both cases).

