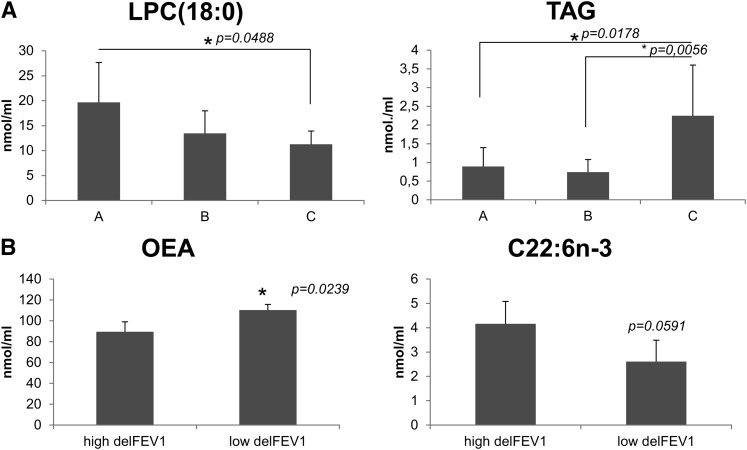
Fig. 4.
A: Plasma lipids associated with the evolution of Pseudomonas aeruginosa chronic infection. Patients were grouped according to their colonization by Pseudomonas aeruginosa at t = 0 and t = 3. A: noncolonized (n = 11). B: noncolonized at t = 0 but colonized at t = 3 (n = 13). C: colonized at both time points (n = 9). ANOVA analysis showed that the three groups were significantly different in terms of LPC(18:0) and TAG content (p = 0.0492 and p = 0.0026, respectively). Post-test showed significant differences between A and C, and between B and C for TAG. No post-test differences were found for LPC(18:0) (*p < 0.05). B: Differences in DHA and OEA between extremes of delFEV1. The five patients showing the highest and lowest values for delFEV1 were chosen for analysis (n = 5; p = 0.0591 for DHA; p = 0.0239 for OEA).

