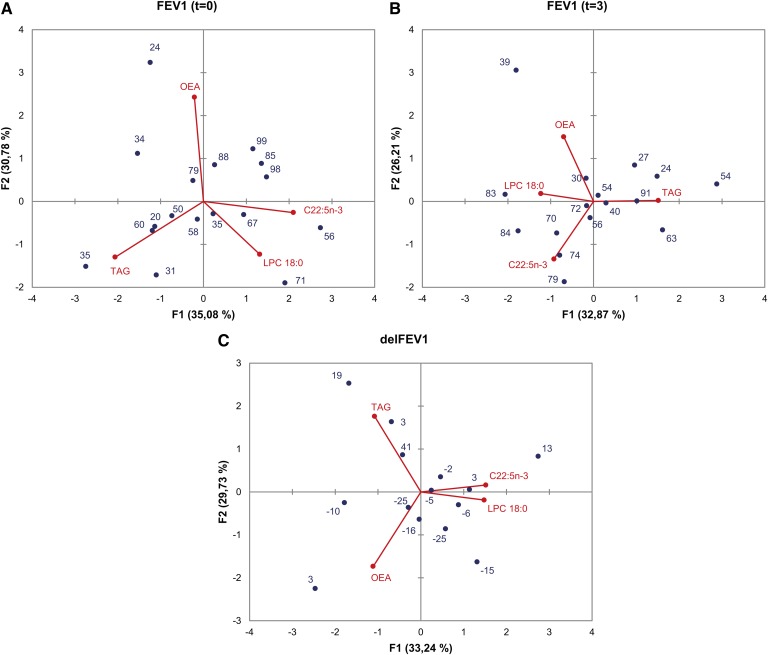
Fig. 5.
Principal component analysis of FEV1 values and plasma lipids. PCA biplots correspond to FEV1 at t = 0 (A), FEV1 at t = 3 (B), and delFEV1 (C) as dependent variables. Blue spots and numbers represent FEV1 values. Red spots and lines represent the four independent variables selected, namely LPC(18:0), C22:5n-3, TAG, and OEA. In each case, variables are represented by the first and second principal components (F1 and F2). Percent contribution of each principal component to total variance is indicated in the respective axis title.

