
Figure 5.
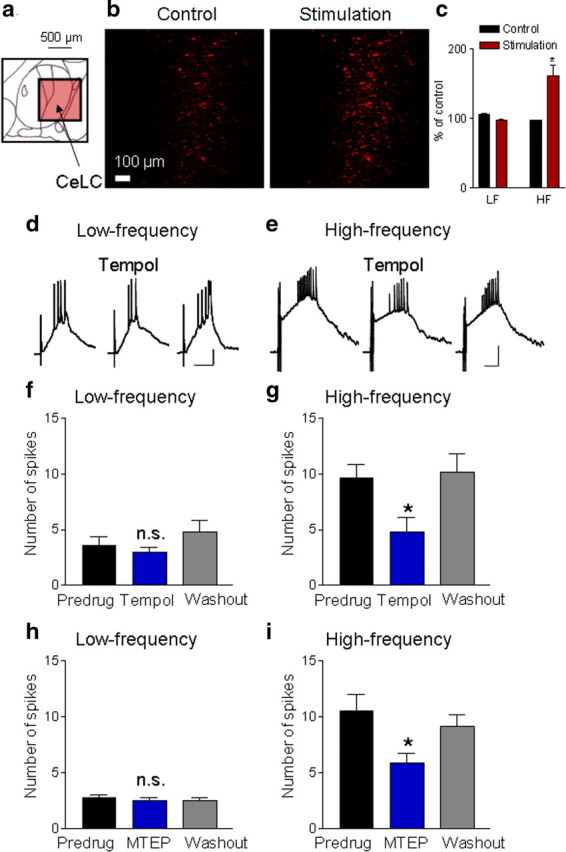
Synaptically evoked increase of mitochondrial superoxide and modulation of synaptic activity by mGluR5 and ROS. a, Diagram (adapted from Paxinos and Watson, 1998) shows the central nucleus with its subdivisions including the CeLC (see Fig. 4b) and the area of the photographs in b (red square). b, Individual images of fluorescence generated by oxidation of a mitochondrial superoxide specific dye (MitoSOX) in live brain slices containing the CeLC (see Fig. 4 and Materials and Methods for quantitative imaging analysis). Photographs were taken before (control) and 10 min after high-frequency stimulation (three trains, five stimuli at 100 Hz; see Materials and Methods). c, Bar histograms show averaged fluorescence activity for 10 min before (control) and 10 min after low-frequency (LF, 1 Hz, 5 min; n = 5 slices) or high-frequency (HF, n = 5 slices) electrical stimulation of PB input (see Materials and Methods). Values are normalized to the first minute of prestimulation control values; *p < 0.05 (compared with prestimulation control, paired test). b, c, High-frequency stimulation increased mitochondrial superoxide fluorescence activity. d, e, Current-clamp recordings of synaptically evoked depolarizations and action potentials before, during, and after superfusion of tempol (1 mm, 10 min) onto the brain slice. Tempol had little effect on synaptic responses evoked by low-frequency (0.033 Hz) stimulation (d) but inhibited responses to high-frequency stimulation (e, 5 stimuli at 100 Hz) of PB-input. Scale bars, 100 ms, 15 mV. f, g, Tempol (1 mm, applied by superfusion) had no significant effect on action potential firing evoked by low-frequency synaptic stimulation (f, n = 5 neurons), but inhibited synaptic activity evoked by high-frequency stimulation (g, n = 5 neurons). h, i, MTEP (1 μm, applied by superfusion) had no significant effect on spike firing evoked by low-frequency stimulation (h, n = 4 neurons), but inhibited synaptic activity evoked but high-frequency stimulation (i, n = 4 neurons). f–i, Bar histograms show means ± SE of the number of synaptically evoked spikes per stimulus before (predrug), during (10 min), and after (washout for 10 min) drug application; n.s., not significant; *p < 0.05 (compared with predrug; Dunnett's multiple-comparison tests).