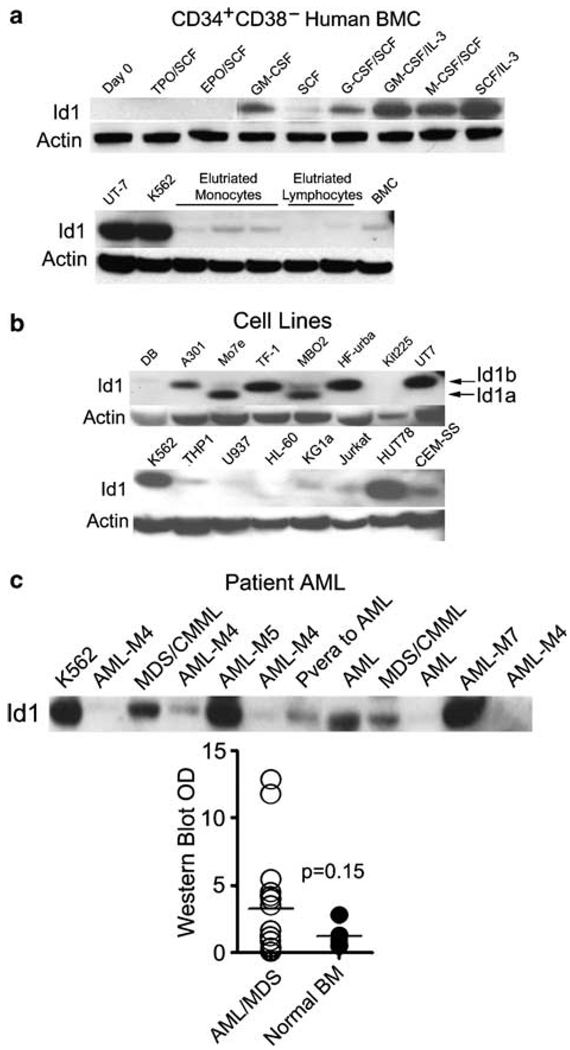
Figure 4.
Evaluation of Id1 protein expression in human bone marrow cells (BMC), human leukemic cell lines and primary acute myelogenous leukemia (AML). (a) Human BMC were thawed and stained with directly conjugated fluorescent antibodies to human CD34-FITC (Clone 581), human CD38-PE (Clone HIT2; BD Biosciences) and then sorted for CD34+/CD38−. Purified CD34+CD38− human BMC were stimulated in complete Iscove’s modified Dulbecco’s medium (cIMDM) with or without cytokines for 6 days prior to harvest and lysis for western blotting (upper panel). Human monocyte and lymphocyte populations were elutriated and analysed for Id1 protein expression. UT-7 and K562 cells were used as positive controls (lower panel). (b) Human hematopoietic cell line lysates were prepared to measure the expression level of Id1 protein. Total cell lysates were separated by SDS–polyacrylamide gel electrophoresis (PAGE) and western blotted to detect Id1. Subsequently, the blots were stripped and stained with anti-actin antibody to demonstrate equal loading. (c) Protein (30 µg) extracted from thawed BM mononuclear cells (MNC) of AML patients and K562 cells were analysed by western blotting for the presence of Id1 protein. Id1 protein levels were evaluated semiquantitatively by measuring the optical density (OD) of Id1 bands compared to that present in K562 (arbitrary value = 10). OD was measured by Image J image analysis software (Image J 1.37V, National Institute of Health, MD, USA; http://rsb.info.nih.gov/ij). The graph shows the distribution of Id1 protein expression levels in 20 patients with AML/MDS and 4 with normal BM MNC. Data are presented as individual values (circles) and medians (horizontal bars; P = 0.15; Student’s t-test).

