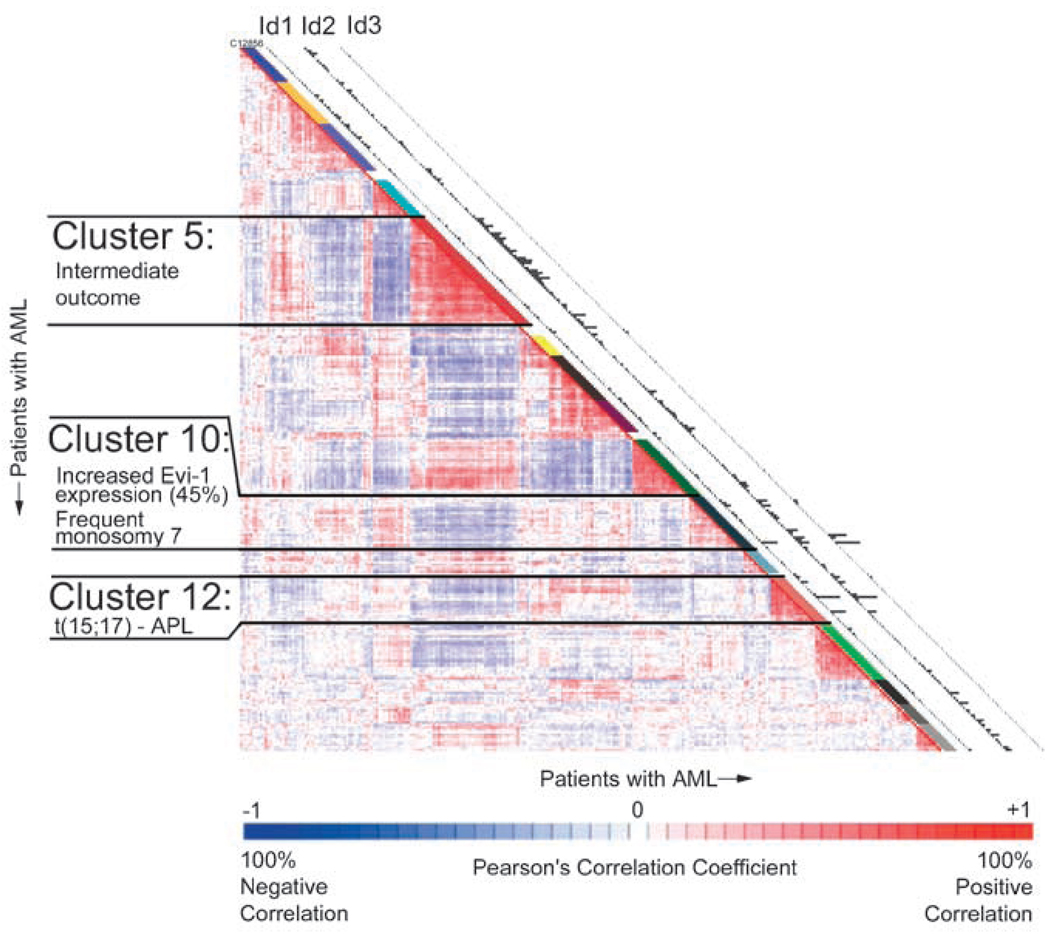
Figure 5.
Microarray analysis from 285 acute myelogenous leukemia (AML) patients. The correlation view displays pairwise correlations between AML patients. The 16 clusters identified in the cohort of 285 AML patients using 2856 probe sets on the basis of the correlation view. Clinical and molecular data are depicted in the columns along the original diagonal of the correlation view. The expression levels of Id1, Id2, Id3 (probe set: 208937_s_at, 201565_s_at, 207826_s_at 209543_s_at for each) in the 285 AML patients are plotted in the column (bars are proportional to the level of mRNA expression).

