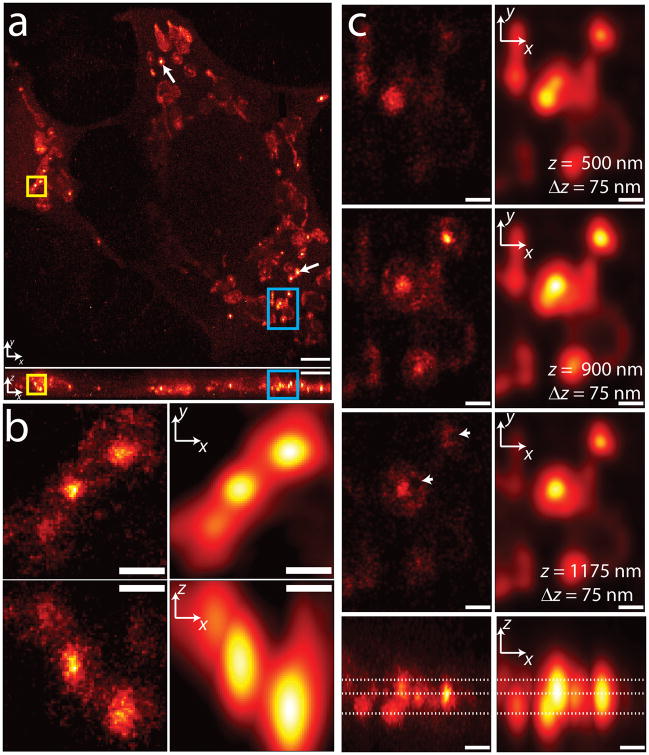
Figure 3.
3D superresolution imaging of a mitochondrial network. (a) xy (top) and xz (bottom) maximum intensity projections of mitochondrial matrix labeled with PA-mCherry1. White arrows show examples of ‘core’ regions of higher intensity inside mitochondria. ~1.2 million unlinked localizations are rendered in each view. (b) Higher magnification xy (top) and xz (bottom) views of the yellow rectangular regions in (a), with both super-resolved (left) and diffraction-limited (right) views compared. (c) Higher magnification xy sections (top three rows) and xz maximum intensity projections (bottom row) of the blue rectangular regions highlighted in (a). xy sections are constructed from all localizations in a 75 nm thick z region, and relative z locations are indicated by dotted lines shown in the xz maximum intensity projection. Both superresolved (left) and diffraction-limited (right) views are shown. Arrowheads indicate void regions that are invisible in the diffraction limited views. Only localizations with correlation strength >0.4 are shown. Histogram bin sizes are 60 nm for (a) and 25 nm for (b) and (c). Supplementary Video 1 steps through xy slices with 60 nm pixel size and 60 nm z separation. Scale bars, 3 μm (a); 0.5 μm (b); 0.5 μm (c).

