Figure 4.
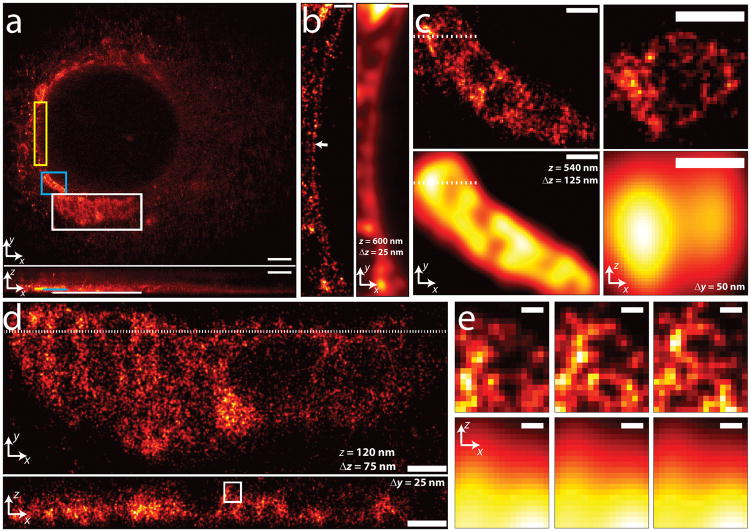
3D superresolution imaging of an ER network. (a) xy (top) and xz (bottom) maximum intensity projections of PA-mCherry1 targeted to the endoplasmic reticulum. ~820,000 unlinked localizations are rendered. (b) Magnified xy views of yellow rectangular region in (a), comparing super-resolved (left) and diffraction-limited (right) views. Localizations within a 25 nm z slice centered 600 nm above the coverslip are shown. Arrow highlights nuclear membrane, resolved to ~25 nm. (c) Magnification of blue rectangular region in (a). Superresolved xy (left, 125 nm z slice centered 540 nm above coverslip) and xz (right, corresponding to the dotted line in xy view, 50 nm y slice) views are shown in top row, corresponding diffraction-limited images in bottom row. (d) Magnification of white rectangular region in (a). Superresolved xy (top, 75 nm z slice centered 120 nm above coverslip) and xz (bottom, corresponding to the dotted line in xy view, 25 nm y slice) views are shown. (e) Magnification of white rectangular region in (d), showing superresolved (top row) and diffraction-limited (bottom row) xz views. Three successive xz views, 25 nm thick in y, 25 nm y spacing between each view are shown. Localizations with correlation strength >0.4 are shown. Histogram bin sizes: 60 nm for (a), 25 nm for (b)–(e). Supplementary Video 2 steps through xy slices with 60 nm pixel size and 60 nm z separation. Scale bars, 3 μm (a); 0.5 μm (b); 0.5 μm (c); 0.5 μm (d); 0.1 μm (e).

